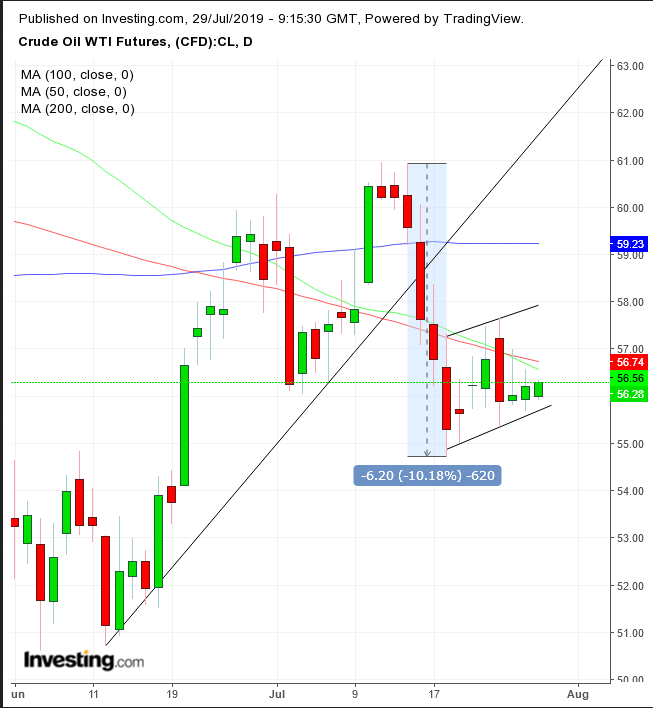
We expect oil prices to continue to fall in the short-term on easing Iran pressures and the outlook for demand. Technically, the price is on course to complete a bearish pattern after already falling below the short-term uptrend line and triggering an especially bearish death cross.
We expect oil prices to continue to fall in the short-term on easing Iran pressures and the outlook for demand. Technically, the price is on course to complete a bearish pattern after already falling below the short-term uptrend line and triggering an especially bearish death cross.
The oil market is being squeezed between several drivers: economic growth, monetary policy, U.S. oil production and Iran.
The oil market is being squeezed between several drivers: economic growth, monetary policy, U.S. oil production and Iran.
The price of WTI crude oil is teetering on the $56 point, 8% lower than the month’s peak amid the tensions with Iran. At the same time, the contracting economy has fueled anticipation of a Fed rate cut on Wednesday. Lower borrowing costs cheapen the U.S. dollar, the currency in which oil is priced — the indirectly cheaper oil is expected to spur demand and push prices higher.
The price of WTI crude oil is teetering on the $56 point, 8% lower than the month’s peak amid the tensions with Iran. At the same time, the contracting economy has fueled anticipation of a Fed rate cut on Wednesday. Lower borrowing costs cheapen the U.S. dollar, the currency in which oil is priced — the indirectly cheaper oil is expected to spur demand and push prices higher.
Meanwhile, however, a strengthening dollar for the seventh day is weighing on oil prices.
Meanwhile, however, a strengthening dollar for the seventh day is weighing on oil prices.
Technical analysis attempts to tally up the total supply and demand, and our interpretation of its visual representation is a continued downtrend.
Technical analysis attempts to tally up the total supply and demand, and our interpretation of its visual representation is a continued downtrend.


The price has been ranging within a rising flag, bearish following the 10% plunge in just 4 days – forming the flagpole – June 15 -18. The flag’s upward bias presumably projects how demand increases as sellers cover shorts and take stock of complex market dynamics as they try to second-guess the rapid move.
The price has been ranging within a rising flag, bearish following the 10% plunge in just 4 days – forming the flagpole – June 15 -18. The flag’s upward bias presumably projects how demand increases as sellers cover shorts and take stock of complex market dynamics as they try to second-guess the rapid move.
The flagpole cuts through the uptrend line since June, and the body developed below the uptrend line, as market dynamics reversed.
The flagpole cuts through the uptrend line since June, and the body developed below the uptrend line, as market dynamics reversed.
The 50 DMA fell below the 200 DMA, even as the latter was falling as well, making it the most potent death cross there is. The fact that this powerful bearish signal developed within the flag increases the chances of a downside breakout, completing the rising flag, signaling that investors are prepared to continue shorting, after drowning out a patch of demand.
The 50 DMA fell below the 200 DMA, even as the latter was falling as well, making it the most potent death cross there is. The fact that this powerful bearish signal developed within the flag increases the chances of a downside breakout, completing the rising flag, signaling that investors are prepared to continue shorting, after drowning out a patch of demand.
Trading Strategies
Trading Strategies
Conservative traders are likely to wait for a trough below the December 2018 low to form a long-term downtrend, while the medium and short terms are trendless for now.
Conservative traders are likely to wait for a trough below the December 2018 low to form a long-term downtrend, while the medium and short terms are trendless for now.
Moderate traders might short after a downside breakout followed by a return move that retests the pattern integrity.
Moderate traders might short after a downside breakout followed by a return move that retests the pattern integrity.
Aggressive traders may short now, counting on the rare death cross with a falling 200 DMA, amid a developing rising flag after falling below the short-term uptrend line.
Aggressive traders may short now, counting on the rare death cross with a falling 200 DMA, amid a developing rising flag after falling below the short-term uptrend line.
Trade Sample
Trade Sample
