The U.S. dollar has been attracting a lot of attention for a while now, especially given its continued rise, even after the Fed reversed its policy in July. That was when the U.S. central bank cut interest rates for the first time in over a decade, followed by two additional cuts later in 2019. But the dollar just chugged along.
On July 31, we noted that while it was true U.S. interest rates were falling, they were still better than the rates in the rest of the developed world, which were at zero or even in some cases below. We provided another reason: Treasurys are considered the world’s safest bonds and foreign demand, by necessity, includes a dollar transaction.

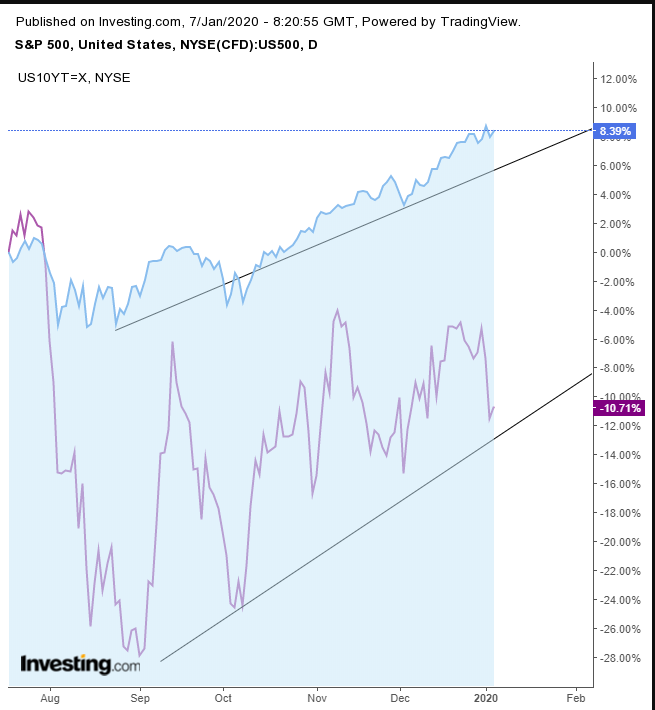
While this is all true, how is it that the dollar managed to climb both during periods of risk-on and risk-off? We might ask the same about the rare positive correlation between yields and equities from September.
The same thing happened after U.S. President Donald Trump’s election victory in November 2016. Equities went up together with yields. Investors simply bought everything. The dollar jumped too, until Trump said a too strong dollar is “killing us” in a January 2017 Wall Street Journal interview, a sentiment reiterated by Treasury Secretary Steven Mnuchin.
The recent upswing in the U.S.-China trade deal prospects boosted equities and this time Treasurys didn’t follow. In the new environment of a growingly dovish Fed and risk-off, investors neglected Treasurys.
So, what is the trajectory for the dollar? Analysis of the charts can help work that out.

The dollar has had an incredible run since its bottom on Feb. 16, 2018, near 1,136 pips or 13%, from the low of 88.25 to the high of 99.67, reached on Oct. 1. After falling since, the greenback is still up 850 pips, or 9.64%, as of the time of writing.
So, after a 328-pip pullback from the peak, an almost 29% correction, perhaps it’s time for the Dollar Index to rebound and resume its uptrend line?
Maybe not.
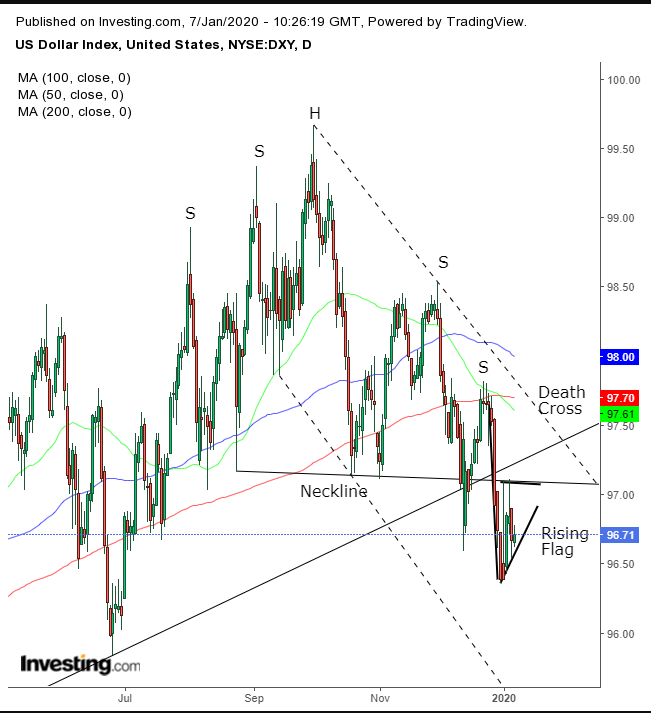
The dollar completed a H&S top, precisely when it fell below its uptrend line since June 2018. It has retested the neckline repeatedly — and it held. The penetration is only 0.75%, which doesn’t even satisfy an aggressive, 1% filter, to avoid a bear trap. However, corrections usually tend to be at least 33%, 4% more than the current one. If the minimum pullback actualizes, we’ll have a more robust filter.
Not only did the H&S complete concurrently with breaking the uptrend line and repeatedly retesting the neckline’s resistance, but a Death Cross was triggered thereafter.
Finally, the very breakout that completed the pattern is a continuation pattern in itself, a rising flag, bearish after the sharp, 1.5% drop in the five days that preceded the range.

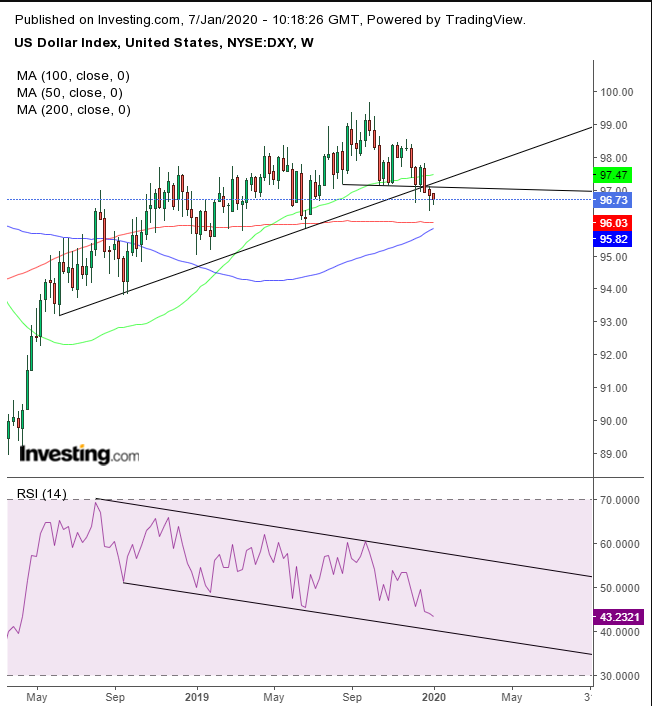
Moreover, when taking the longer view on the weekly chart, we see that the RSI provides an obvious negative divergence, demonstrating how momentum is failing to keep up with the price.
Trading Strategies
Conservative traders would wait for a low below that of the June 24, 95.97 trough, followed by a pullback that confirms oversupply.
Moderate traders may wait for that break of the June low with the pullback for a better entry, not necessarily for further evidence of a reversal.
Aggressive traders may short after the flag downside breakout, with the option of waiting for the pullback for an entry closer to resistance.
Trade Sample
