Chart Of The Day: The Bullish Case For Oil

Published 11/09/2019, 10:44 pm
Updated 02/09/2020, 04:05 pm
CL
-

Oil is falling on the news that U.S. President Donald Trump's hawkish National Security Adviser John Bolton has been sacked. This is seen as dampening military risk, which in turn pushes down oil prices. However, there's another view that sees dwindling U.S. stockpiles and shale production, compounded by improving U.S.-China trade relations, as very likely to boost oil prices.

API reported stockpiles dropped by 7.2 million barrels in the week ending Sept. 6 to 421.9 million, far more than the expected 2.7 million barrels. Analysts expect the EIA to confirm a drawdown if 4.8 million barrels.

In terms of U.S. production, there are signs of weakening shale production, with output shrinking to less than 100,000 bpd during the first seven months of the year, compared to a 600,000 bdp increase during the same period in 2018.
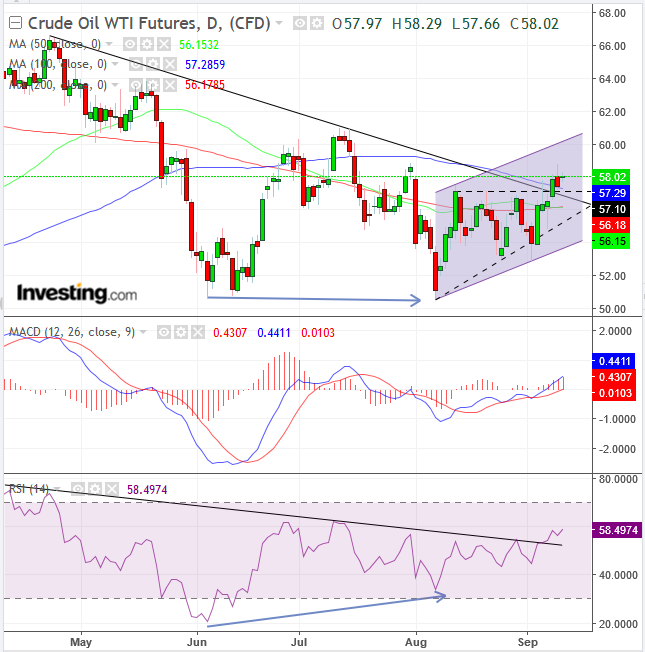
WTI Daily Chart

Despite the drop in the oil price following the news of Bolton's departure, prices remained above both the downtrend line since April and the 100 DMA. Right now, prices have rebounded from a dip and are in positive territory.

The trading pattern since the August low has developed a small ascending triangle, whose rising lows demonstrate over-eagerness relative to the flat supply at the pattern top.

The 50 and 200 DMAs are intertwining, as the decline from October 2018 and the rise since December 2018 wrestle for trend dominance, with explosive potential.

The MACD is providing repeated buy signals after a series of bounces of the short MA on the long MA, moving it back above the zero line.

The RSI is demonstrating that momentum supported the price breakout, after providing a positive divergence when it rose from June to August while the price languished.

As of now, the short-term trend is up, after establishing two rising peaks and troughs from the August bottom, while the medium-term is sideways.

Trading Strategies – Long Position Setup

Conservative traders may wait for the price to fall back toward the channel bottom above the downtrend line since April.

Moderate traders might risk a position upon any return to the channel bottom, after it finds support.

Aggressive traders may enter a long position now, relying on the support of the downtrend line since April and triangle top.

Trade Sample

  • Entry: $57
  • Stop-Loss: $56 — below the convergence of April's downtrend line and the triangle’s apex.
  • Risk: $1
  • Target: $60 — round number psychological resistance below July highs.
  • Reward: $3
  • Risk:Reward Ratio: 1:3
  • Latest comments

    Loading next article…
    Risk Disclosure: Trading in financial instruments and/or cryptocurrencies involves high risks including the risk of losing some, or all, of your investment amount, and may not be suitable for all investors. Prices of cryptocurrencies are extremely volatile and may be affected by external factors such as financial, regulatory or political events. Trading on margin increases the financial risks.
    Before deciding to trade in financial instrument or cryptocurrencies you should be fully informed of the risks and costs associated with trading the financial markets, carefully consider your investment objectives, level of experience, and risk appetite, and seek professional advice where needed.
    Fusion Media would like to remind you that the data contained in this website is not necessarily real-time nor accurate. The data and prices on the website are not necessarily provided by any market or exchange, but may be provided by market makers, and so prices may not be accurate and may differ from the actual price at any given market, meaning prices are indicative and not appropriate for trading purposes. Fusion Media and any provider of the data contained in this website will not accept liability for any loss or damage as a result of your trading, or your reliance on the information contained within this website.
    It is prohibited to use, store, reproduce, display, modify, transmit or distribute the data contained in this website without the explicit prior written permission of Fusion Media and/or the data provider. All intellectual property rights are reserved by the providers and/or the exchange providing the data contained in this website.
    Fusion Media may be compensated by the advertisers that appear on the website, based on your interaction with the advertisements or advertisers.
    © 2007-2025 - Fusion Media Limited. All Rights Reserved.