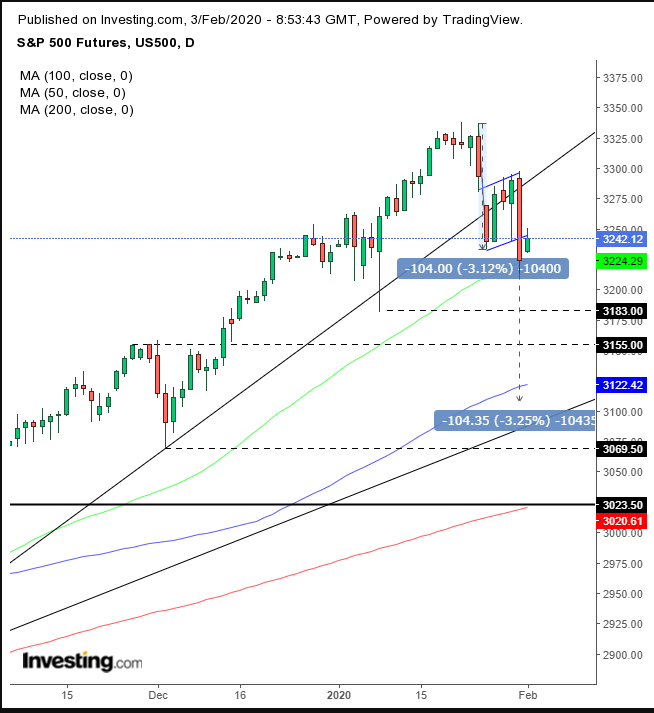
There are a slew of attractive buying opportunities on the market at the moment, but technical signals are indicating that S&P 500 futures may be ripe for a deeper pullback first.
U.S. futures have been paring losses and Asian equities are off their lows, but it would be a mistake to think the worst is behind us. The death toll from the coronavirus has reached 360 people and is climbing, with no signs of a slowdown.
Chinese markets dropped as much as 9% earlier today while demand for oil in China plummeted a staggering 20%.
However, after a 3% decline, traders have bid up contracts on the S&P 500 index 0.7%. Could this be suggesting the market is turning around? While it is, of course, possible, we don’t think this is what's happening. The chart offers a bit more clarity.

The first sign of trouble was when the contract slipped below its uptrend line since the Oct. 3 low. Then, the S&P futures tried to climb back above the broken uptrend line, consolidating in the shape of a rising flag — a bearish formation following the 3% drop. The reason there is an expectation of a downside breakout is that the upward tight price move is seen as profitable to short sellers, thus attracting new bulls to come in to resume the short.
The downside breakout was complete, albeit with less than 0.7% penetration, allowing for a bear trap. However, the fact that the bearish flag developed right on top of the broken uptrend line since the Oct. 3 bottom vouches for its tenacity. Also, the 50 DMA providing support for the flag underscores its significance as a technical pressure point on the chart.
Both MACD and RSI agree in their downward projection.
So, what's the target? While every previous high and low can serve as a support, as traders remember those prices and their aftermath, a flag’s implied target is based on the length of its flag pole, in this case the previous sharp move is 104 points.
This target retests the uptrend line since the Dec. 24 2018 bottom, the worst Christmas Eve for markets on record. The significance of this uptrend line is emphasized as the 100 and 200 DMAs hug it in support.
The next crucial intersection for traders is the 3,000 psychological level, a major resistance line since April, which required four rallies to overcome.
Trading Strategies – Short Position Setup
Conservative traders would consider a short only after a 3% penetration to filter out a bear trap, taking the price to 3,145, then wait for a return move to successfully retest the flag.
Moderate traders would be content with a 2% downside breakout to 3,176, then wait for a pullback for a closer entry to resistance, not necessarily to retest the breakout.
Aggressive traders may short now, providing they accept the risk of a bear trap and write a trading plan accordingly.
Trade Sample
