After its stunning double-digit advance since June, the S&P 500 Index is showing signs of a potential correction. Also, a rare pattern is emerging — a broadening pattern — that if completed would herald a bear market.
The Index fell 0.65% yesterday, its second day of losses, with a total drop over the two sessions of just below 1.00%. Industrials (-2.14%) underperformed after railroad behemoth CSX (NASDAQ:CSX) plunged 10% into a downtrend after soft guidance for sales. Although, the SPX was hit by industrials, the sour mood was more widespread than that, with all but defensive Utilities (+0.38%) and Healthcare (+0.02%) in negative territory.
CSX had delivered excellent results before this, jumping almost 30% YTD and outperforming the 21% gain of the Dow Jones Transportation Index. The current slump and weak guidance are the direct result of falling demand amid the protracted U.S.-China trade war, and the sector is feeling it hard.
Will falling demand for goods persist? Based on the charts, it's possible to attempt to form a trajectory showing which price levels to look out for.

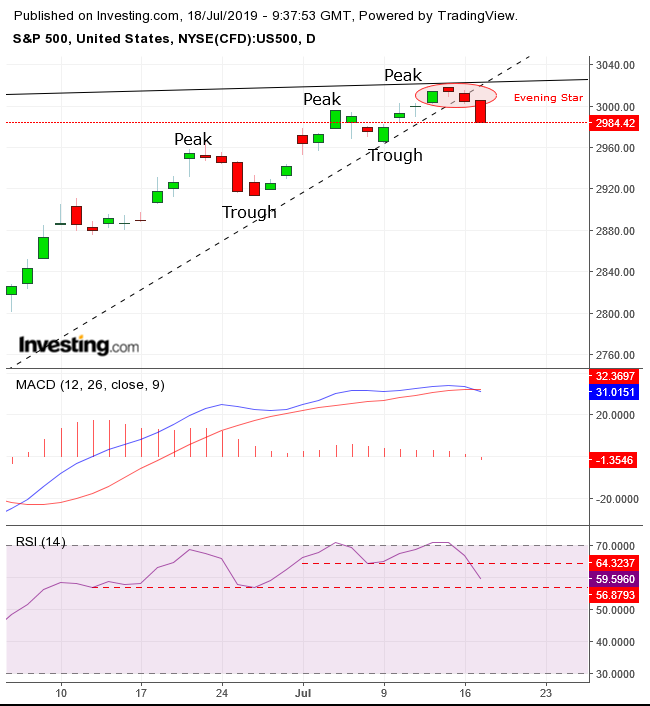
The SPX has completed an evening star – a three-candlestick bearish pattern depicting a top – and Wednesday’s selloff cleared the short-term uptrend since June 3, raising the odds of a short-term reversal and completing a descending series of peaks and troughs.
The MACD triggered a sell signal, when the short MA fell below the long MA, as current prices are weakening relative to the average of the longer period.
The RSI has completed a double top falling below July lows and may continue to form a triple top, falling below the June lows, suggesting prices may follow.
While all these bearish triggers paint a bleak picture in the short term, they increase the odds of a long-term correction as a larger pattern emerges.

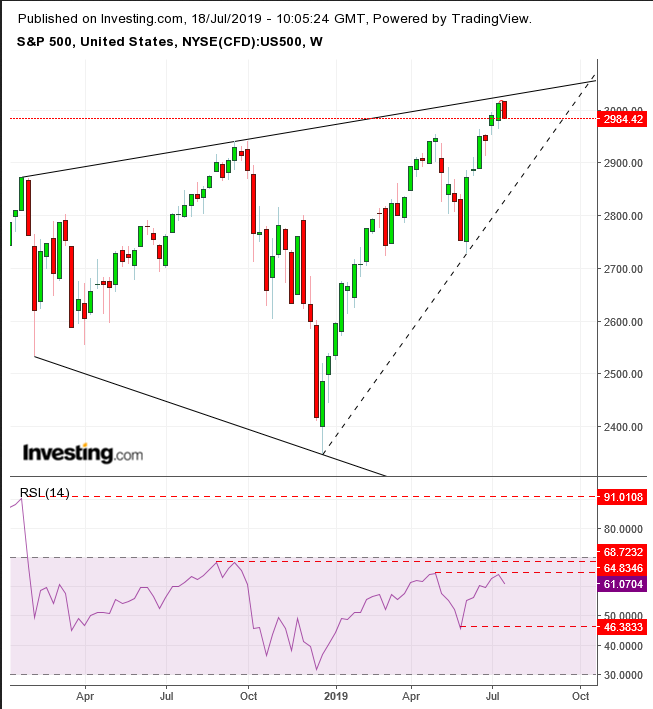
When stepping back to look at the bigger picture, a rare broadening pattern emerges. The placement of the evening star is arguably more important than the pattern itself. Its development precisely below the upper boundary of the broadening formation exponentially increases its bearish value, as the proximity lends credence to the significance of the supply increase.
The characteristics of the broadening pattern are rising peaks and falling troughs, a contradiction in market structure. If investors believe in long-term growth, they should support prices, pushing for higher lows, to accompany the higher highs, thus forming a coherent long-term uptrend. On the other hand, if investors expected company profits to diminish, they should sell on the rallies, forcing lower highs as well as lower lows.
This paradoxical price structure projects a severe lack in market leadership, when participants can’t stick to a consistent strategy. Therefore, this is considered a very bearish pattern that develops at market tops but is completed only when the lower boundary is breached.
Note of caution: trend lines are tricky things, and it takes substantial experience to develop an eye for this over-commercial but illusive skill. Given that the broadening pattern’s boundaries change along with trend lines that recede from each other, it’s challenging to determine when the pattern is complete. Even then, it requires experience to know how to navigate the trade afterward. However, we will attempt to keep on top of developments and do our best to guide you along.
Note also that the weekly RSI has been providing a consistent series of negative divergences, with each RSI peak falling lower, contradicting the rising price peaks. The recent RSI peak – well below that of the start of the broadening pattern, despite hitting a record high – may give us a heads up to a price correction, if the RSI falls below its June low ahead of the price.
Trading Strategies
Conservative traders would wait for the pattern to either complete, with a decisive downside breakout of the broadening pattern, which is a long way off, at the 2,000 level to go short, or for the pattern to blowout, with prices over the 3,100 level (at the current angle) to go long.
Moderate traders may short after the short-term trend develops a falling series of peaks and troughs.
Aggressive traders may short now, counting on the evening star’s development precisely below the broadening top, as well as the bearish indicators.
Note: If a traders shorts now, he must be prepared that the price could retest the resistance, and either accept being stopped out or committing to a generous stop-loss, thus increasing potential loss. If he chooses to wait for an upward move, he risks losing the position. Therefore, it’s crucial to develop a trading plan that fits the account the trader is committed to.
Trade Samples
Immediately
- Entry: 2,985
- Stop-Loss: 3,020 – above peak
- Risk: 35 points
- Target: 2,880
- Reward: 105 points
- Risk-Reward Ratio: 1:3
Upon Upward Move
- Entry: 3,000
- Stop-Loss: 3,020 – above peak
- Risk: 20 points
- Target: 2,940
- Reward; 60 points
- Risk-Reward Ratio: 1:3
