Breaking News
Get 45% Off 0
🌊 NVIDIA ripple effect: Track AI stocks' response to chip giant's earnings
Explore AI Stocks

Chart Of The Day: Southwest Airlines Shares Take Off On Reflation Trade

By Investing.com (Pinchas Cohen)Stock MarketsMar 10, 2021 01:44
au.investing.com/analysis/chart-of-the-day-southwest-airlines-shares-take-off-on-reflation-trade-200453416
Chart Of The Day: Southwest Airlines Shares Take Off On Reflation Trade
By Investing.com (Pinchas Cohen)   |  Mar 10, 2021 01:44
Saved. See Saved Items.
This article has already been saved in your Saved Items
 
 
NDX
-0.33%
Add to/Remove from a Portfolio
Add to Watchlist
Add Position

Position added successfully to:

Please name your holdings portfolio
 
US500
+0.01%
Add to/Remove from a Portfolio
Add to Watchlist
Add Position

Position added successfully to:

Please name your holdings portfolio
 
LUV
-0.72%
Add to/Remove from a Portfolio
Add to Watchlist
Add Position

Position added successfully to:

Please name your holdings portfolio
 

For going on three weeks now we've been discussing the market's inflation 'conundrum'—the question of whether rising inflation will help or hinder economic growth. The most recent version of the narrative, exacerbated by escalating oil prices, says inflation could get in the way of a substantial recovery, as countries come out of lockdowns thanks to vaccines.

We, however, have been challenging that conclusion, based on a more nuanced take on recent market activity. We recognized that even during any hiatus in the selloff, investors continued rotating out of growth stocks such as big tech, whose valuation ballooned throughout the pandemic, moving instead into value sectors, which were pressured throughout lockdowns and social restrictions.

Yesterday, we provided a bearish call on the tech-heavy NASDAQ 100, the index which lists some of the most elite, mega cap tech shares. Today we're offering a bullish take on a beaten down travel stock, Southwest Airlines (NYSE:LUV), whose fortunes could be said to epitomize the current state of value shares.

As opposed to the broader market, which bottomed during March and then rebounded, Southwest only managed to begin coming back in May, after having reached its lowest level since January 2014. It stands to reason that if planes can't find passengers, the company won't profit. As such, the price bounced back only after finding support at the highs before the dotcom crash.

Since then, shares have been rising slowly, but have gained 38% since the low. The S&P 500 has rallied as much as 80% over the same period, more than double that of Southwest shares. But while the benchmark index fell almost 6% since its Feb. 16 high, it's still up a bit more than 3% so far this year. In comparison LUV, which closed yesterday at $60.55, its highest since October 2018, is up a bit more than 34% since the start of the year.

So, while the broader market is now in a downturn, Southwest is taking flight, and has exhausted only half the rebound move relative to the broader market.
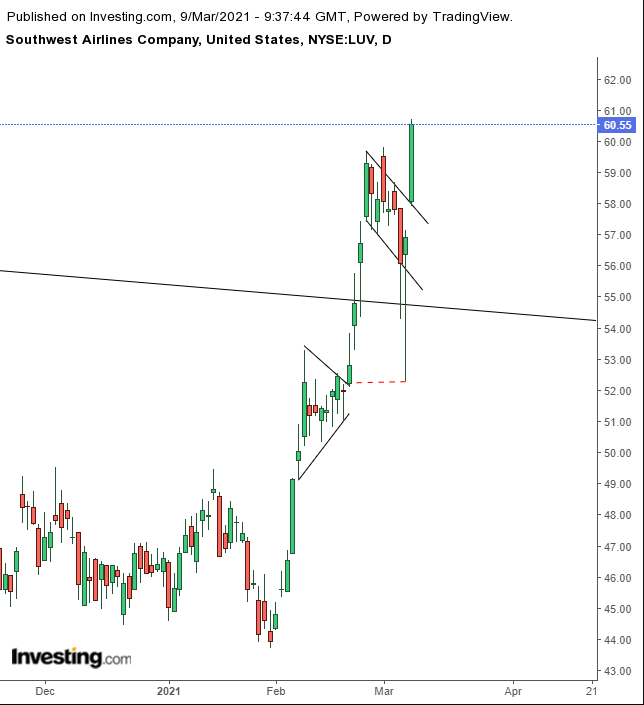
LUV Daily
LUV Daily

The stock provided an upside breakout to a falling flag, bullish after the 7.5% jump in just four days. That was an upside breakout of a previous continuation pattern, a pennant. Notice how Friday’s low found support precisely by the breakout of the pennant.

The flag tilted downward as investors took profits following the sudden, sharp gains. The flag developed after the price cut through the downtrend line since its December 2017 record.

The flag bottom and Friday’s extreme low, a powerful hammer, developed right on top of that long-term downtrend line, demonstrating a supply-demand balance reversal. The fact that the price overcame the downtrend line from the record may further embolden bulls.

Trading Strategies

Conservative traders should wait for the price to retest the flag’s integrity.

Moderate traders would wait for a dip for a better entry, if not for evidence of support.

Aggressive traders could go long at will, provided they understand and accept the added risk. They should only do so after writing a coherent trading plan they commit to following.

Here’s just one example:

Trade Sample

  • Entry: $59
  • Stop-Loss: $57
  • Risk: $2
  • Target: $65
  • Reward: $6
  • Risk:Reward Ratio: 1:3

Chart Of The Day: Southwest Airlines Shares Take Off On Reflation Trade
 

Related Articles

Chart Of The Day: Southwest Airlines Shares Take Off On Reflation Trade

Add a Comment

Comment Guidelines

We encourage you to use comments to engage with users, share your perspective and ask questions of authors and each other. However, in order to maintain the high level of discourse we’ve all come to value and expect, please keep the following criteria in mind: 

  • Enrich the conversation
  • Stay focused and on track. Only post material that’s relevant to the topic being discussed.
  • Be respectful. Even negative opinions can be framed positively and diplomatically.
  •  Use standard writing style. Include punctuation and upper and lower cases.
  • NOTE: Spam and/or promotional messages and links within a comment will be removed
  • Avoid profanity, slander or personal attacks directed at an author or another user.
  • Don’t Monopolize the Conversation. We appreciate passion and conviction, but we also believe strongly in giving everyone a chance to air their thoughts. Therefore, in addition to civil interaction, we expect commenters to offer their opinions succinctly and thoughtfully, but not so repeatedly that others are annoyed or offended. If we receive complaints about individuals who take over a thread or forum, we reserve the right to ban them from the site, without recourse.
  • Only English comments will be allowed.

Perpetrators of spam or abuse will be deleted from the site and prohibited from future registration at Investing.com’s discretion.

Write your thoughts here
 
Are you sure you want to delete this chart?
 
Post
Post also to:
 
Replace the attached chart with a new chart ?
1000
Your ability to comment is currently suspended due to negative user reports. Your status will be reviewed by our moderators.
Please wait a minute before you try to comment again.
Thanks for your comment. Please note that all comments are pending until approved by our moderators. It may therefore take some time before it appears on our website.
 
Are you sure you want to delete this chart?
 
Post
 
Replace the attached chart with a new chart ?
1000
Your ability to comment is currently suspended due to negative user reports. Your status will be reviewed by our moderators.
Please wait a minute before you try to comment again.
Add Chart to Comment
Confirm Block

Are you sure you want to block %USER_NAME%?

By doing so, you and %USER_NAME% will not be able to see any of each other's Investing.com's posts.

%USER_NAME% was successfully added to your Block List

Since you’ve just unblocked this person, you must wait 48 hours before renewing the block.

Report this comment

I feel that this comment is:

Comment flagged

Thank You!

Your report has been sent to our moderators for review
Continue with Apple
Continue with Google
or
Sign up with Email