The single theme dominating the equity market narrative right now is US President Donald Trump's escalating trade war and its two central adversaries, the US and China. Despite repeated selloffs, US stock indices and the dollar both remain in uptrends.
The same can't be said for Chinese equities, however. As of this morning, the Shanghai Composite has officially entered a bear market, after share prices on the index fell 20 percent from their January high. The Chinese yuan has also slipped, down 5 percent versus the USD.
While the Fed has been raising rates and even boosted its outlook for an additional, fourth hike this year, China's central bank, the People’s Bank of China, shocked investors by leaving rates on hold. China is afraid of a credit crunch, which would mean liquidity was drying up, stopping all investment. This rate decision followed the recent triple blow to China’s economic growth when industrial production, retail sales and infrastructure investments all came in at multi-year to record lows.
In contrast, the US economy continues to expand. Unemployment is at its lowest level since 2000, and measured wage growth is keeping inflation relatively contained. At the same time, consumer confidence remains high.
It seems the US is better positioned to withstand an accelerating trade war. This is what's emboldened President Donald Trump’s stance versus China.
While China’s economy has been slowing, the US expansion continues apace. At this juncture, Chinese officials are wondering whether they've embarked on a war they have even a slim chance of winning.

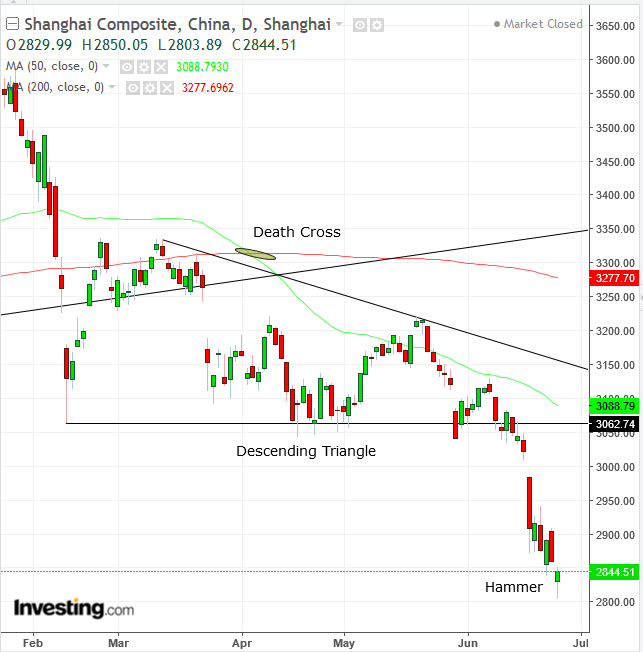
Prices on China's benchmark index have tumbled to an aggregate loss of 20 percent as of this morning, from the January high of 3,600. That’s the officially accepted criterion for a reversal to be considered a bear market, in which gains are seen as nothing more than an upward correction within a falling trend.
Today’s slide may have also completed a continuation pennant pattern, following the preceding, sharp, 6.25 percent drop in just three sessions, from June 14-19. Between February and June, prices completed a Descending Triangle, signaling that the bears who have been pushing prices down since January are outpacing demand, executing a Death Cross, when the 50 DMA (green) crossed below the 200 DMA (red) during the pattern development.
Note, however, that trading developed a bullish hammer upon nearing the bottom of its falling channel, when bulls had the final say of the day, pushing prices back up. This may signal a return move toward the descending triangle.
Trading Strategies
Conservative traders would wait for a return move to the descending triangle or at least the channel top, for evidence that the downtrend is intact, with at least one long, red candle engulfing a green or small candle of any color.
Moderate traders may wait for a return move at least to 2,800, at pennant level.
Aggressive traders may risk a short immediately, provided they can afford a stop-loss above 2,880 or the loss of the position.
