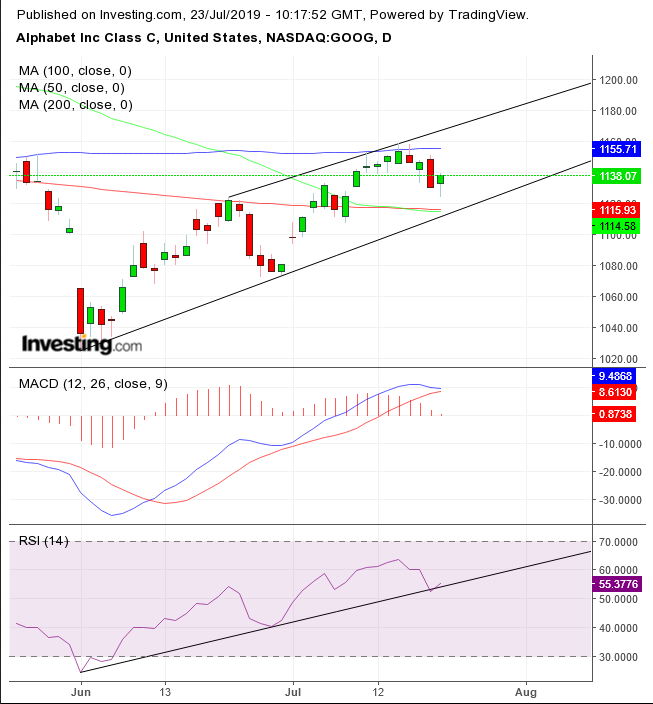
If Google's (NASDAQ:GOOGL) Alphabet's advertising sales growth is in a downtrend, why is the stock in an uptrend?
Alphabet is due to release 2Q results Thursday after the bell, with analysts expecting EPS of $11.1 and revenue of $38.16B. Last year's 2Q saw the company posting EPS of $11.75, easily beating the $9.64 expectation and revenue of $32.66B, well above the $25.58B forecast. But that was last year. 2019 has started very differently, with Q1 proving a major disappointment that led to the digital advertising giant's stock tanking as much as 20%.
The company's 1Q report in April, which came after a period of phenomenal growth in ad sales, showed that advertising sales growth had slowed to 15%, down from 20% in the previous quarter and down 24% from the same quarter in the previous year. It marked the slowest ad sales expansion in over three years, suggesting deepening pressure from increased competition in digital advertising drove the stock down as much as 7% in the following day's trading.
But investors are now buying the stock again: the price has recouped around half of its post Q1 losses, and closed yesterday at $1,138.07, up from its June 3 low of $1.025. So, given that digital ad sales made up 85% of Google’s Alphabet revenue in Q1 — and its ad sales growth was already showing cracks — why would investors be amassing holdings ahead of the earnings follow-up, as is projected in the company’s chart?

Prices have been climbing steadily within a rising channel since the post Q1 20% plunge and paring, as of last week, half of that correction.
The last leg in the rally traversed the 200 DMA, adding weight to the evidence that the price has set its sights on the April highs from before the previous report, extending its medium-term uptrend.
The RSI has bounced off, for now, above its uptrend line for the same time, and before the price reached the bottom of its rising channel.
The MACD’s short MA has been falling toward the long MA. However, the RSI’s move suggests its shorter MA too could bounce off its long MA, as it did in late June along with the previous leg in the rally.
However, the price has yet to recover from its near bear-market, 19.5% plunge. That pulled the 50 DMA below the 200 DMA, which, strictly speaking, triggers a death cross, however it's been mitigated by the fact that the 200 DMA is flat. A falling 200 DMA would have been a stronger signal.
Meanwhile, the price found resistance by the 100 DMA, as it aligned with the top of the rising channel: a resistance, as it marks where buyers take profits, increasing supply and lowering demand. If Alphabet does, in fact, shake off the perception that it hit a ceiling for its advertising sales growth, the price will continue along its upward trajectory, cross over the 100 DMA and pull the 50 DMA back above the 200 DMA, turning it to support.
Trading Strategies
Conservative traders may wait for another opportunity, before the price rises halfway to its next peak.
Moderate traders may wait for a fuller correction toward the channel-bottom, reinforced by the 200 DMA.
Aggressive traders may enter a long position at will, after having calculated a minimum 1:3 risk-ratio along with viable support-resistance points.
Trade Sample: Immediate
In order to avoid being stopped out, the trader assumes considerable exposure, which forces him to wait for a big move, to justify his position’s risk.
- Entry: $1,138
- Stop-Loss: $1,113 – uptrend line
- Risk: $25
- Target: $1,213
- Reward: $75
- Risk-Reward Ratio: 1:3
Trade Sample: Patience
Waiting for a deeper correction to allow for a closer stop-loss runs the risk of losing the position altogether. If the trader doesn’t like the big exposure and is concerned about losing the position, he would do well to wait for another, more reliable position. A good analysis doesn’t promise a good trade.
- Entry: $1,115 – 200 DMA
- Stop-Loss: $ $1,111 – uptrend line
- Risk: $4
- Target: $1,127 (A further target would achieve a great RRR)
- Reward: $12
- Risk-Reward Ratio: 1:3
