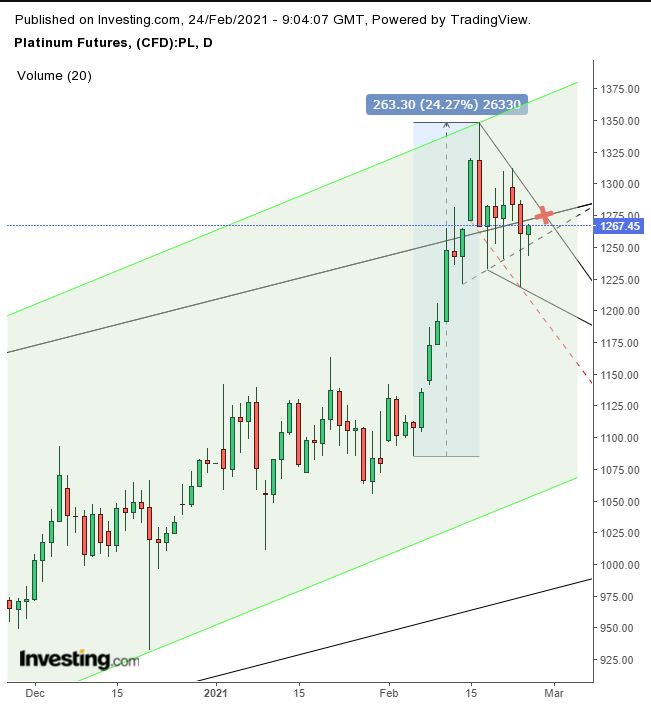
The price of platinum, the precious metal commonly used in catalytic converters which help limit auto engine emissions, has been fluctuating wildly for over a week. On Feb. 16, the metal—which had until recently been lagging other precious metals—pushed above $1,300 per ounce, for the first time since September 2014.
Platinum's surge has primarily been driven by the emerging view that demand for the precious metal will accelerate, as stricter emission regulations to limit pollution from vehicles could be enacted by the Biden administration as the US economic recovery gains traction. One knock-on result would be a tighter supply of platinum as carmaker demand for the essential commodity picks up speed.
Another reason for the price volatility: platinum is increasingly being viewed as an alternative safe haven choice with which to store value, as well as an inflation hedge, after gold’s price run-up last year faltered and failed. Technicals, though not quite as simple, are bolstering the fundamental view of higher platinum prices ahead.

We believe the range since last week is either a falling flag or pennant. Both are equally bullish and have the same dynamics. They follow a sharp move and are expected to be continuation patterns.
The psychology behind the current trading is that early bulls, who enjoyed a nearly 25% rise in value during the two weeks between Feb. 4 and 16, are now taking profit, while new bulls—upset at missing the first move—now recognize the pattern as bullish and are hopeful of a repeat performance that will allow them to also benefit.
The upside breakout demonstrates that demand absorbed all available supply within the pattern, then ventured above the range to continue to consume. This signals another leg up, as buyers show their hand and indicate they want more.
In addition, a breakout tends to set up a chain reaction, including short covering, triggered longs and recognition of the continued uptrend by those who were previously on the sidelines.
Another sign this pattern is meaningful comes from its location on the chart. It developed right at the top of a rising channel since the March bottom. That fits with the puzzle of a market that is attempting to break a resistance, a trendline that has tracked the angle where selling outpaced buying.
In this dynamic, the flag/pennant is the market version of a slingshot. The trend needs to gather momentum to overcome the bearish stronghold. Once it does so, that flips the outlook, turning the resistance to support, which also “supports” the previous assertion of the aftermath of a flag/pennant breakout.
This may be a good time to remind readers the price is struggling against the top of a rising channel which means it’s not a done deal that it will break out. It may very well return to retest the bottom of the rising channel.
This pattern is dynamic, which explains the recent fluctuations we mentioned earlier. That's why it’s difficult to determine the correct trendlines.
Is it a falling flag, along the solid black bottom line or the dotted red line? Or is it a pennant, along with the dotted black line? We're not sure. That’s why chart analysis is subjective, which has been a core criticism of the discipline. That, however, is what also determines a master from a novice. Since there's no rule book, the skill must be carefully acquired via much practice and failure.
So, if the pattern boundaries aren't obvious, how do we to know when it completed? We don’t actually know, but we expect the following factors to increase the probability of a correct read:
- Note that the top boundary is clear. That’s the one we care about it when determing an upside breakout.
- The position of the red X, the place where the top of the pattern meets the top of the channel.
- The range is congested, with all the real bodies within the range overlapping; a breakout would perhaps be apparent when that ends, with a long candle, clearing the other candles within the range. (This may, in fact be evidence against a pennant, as the Feb. 12 candle, where the supposed pennant bottom begins is not, in fact, overlapping with the remaining candles.)
Trading Strategies
Conservative traders should wait for an upside breakout that would clear the Feb. 16, $1,348.30 flag high, then wait for a return move that would retest the top of the flag or the rising channel, depending on where demand will kick in.
Moderate traders would wait for a breakout above the $1,300 psychological, round number, then wait for a pullback, for a better entry, if not for confirmation.
Aggressive traders could risk a long position upon a close above the red X, provided they understand and accept the risk. It should go without saying that they must actually read the full article carefully as well as have a well thought out trade plan they'll stick to.
Here’s just an example:
Trade Sample
- Entry: $1,275
- Stop-Loss: $1,250
- Risk: $25
- Target: $1,350
- Reward: $75
- Risk:Reward Ratio: 1:3
