Oil is in positive territory on Thursday, but remains volatile, as the market narrative flips from a bullish focus on continued stimulus, to a bearish return to worry about increasing coronavirus cases.
Some US states have reported a renewed spike in cases. Arizona reported a record-high number of new confirmed cases on Tuesday, while Texas reported an 11% daily increase in hospitalizations for patients with COVID-19 on Wednesday. This is the eighth new high in less than two weeks.
So much rides on the resumption of normal economic activity. Oil is particularly sensitive to social distancing, as it means less travel. Oil prices have been swinging along higher, on the assumption of a return to some normality. That optimism appears to have dimmed somewhat, leaving oil to trade broadly sideways for the past two weeks.

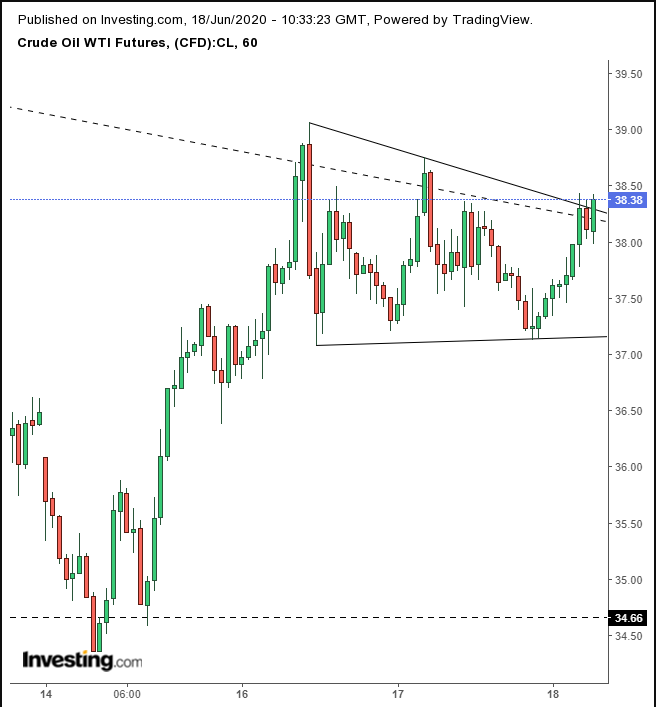
In yesterday's final hour of trading, the price formed a piercing candle stick pattern – a two-candle bearish formation that suggests weakness – precisely at the top of a descending triangle. At the time of writing, the price is rising towards the top of this bearish pattern.
The reason this price structure suggests that risk is skewed to the downside is that sellers have progressively lowered their offers – from above $39, to the high $38s, to below $38.50 - while buyers have remained active at the low end of the $37-per barrel mark. Should this dynamic persist, with sellers being more eager than buyers, the pattern will break to the downside, below $37.
That downside breakout will clearly demonstrate that there is no buying interest above $37, and sellers, who have consistently been growing uneasy whenever oil has moved above this level, will be forced to compromise on price and take whatever buyers are offering.
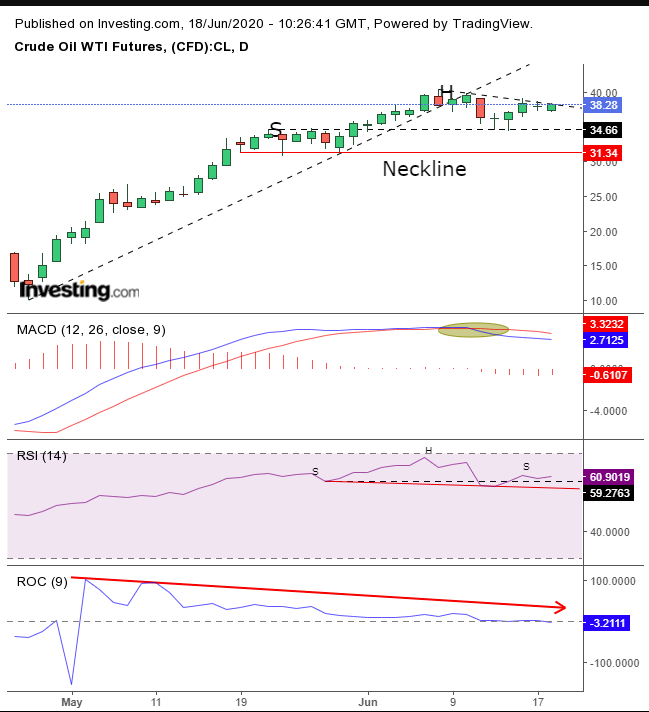
Should this bearish scenario play out, it could create a much larger top on the daily chart.

The inability of the price to break above the trendline that has run since the June 8 peak – the head of a potential H&S top – for three straight days, suggests a reversal pattern may be forming.
Technicians might argue about which pattern is developing: an asymmetrical, complex H&S, or a descending triangle. But this is academic.
A fall below $31 is likely to signal a top – depending on the pattern in which prices fall. The extent of the decline is meaningful. The more signs there are that bulls are putting up a fight, the more reliable the premise for a reversal, rather than a downward corrective move, where bulls would have had ample time to cash out and allow others to carry the load. The latter is necessary for a healthy, sustained rally within a continued uptrend.
The MACD’s short-term MA has crossed below the long-term MA, triggering a sell signal.
The RSI is already forming a potential right shoulder for a H&S top in terms of momentum, while the ROC – also a momentum-based indicator – has diverged, suggesting that momentum has been spluttering, which appears to be at odds with the price-rise that formed the head of the H&S pattern.
For now, we’ll watch how the give-and-take between market participants plays out on the hourly chart.
Trading Strategies – Short Position Setup
Conservative traders - Will wait a close below $36.40, the low just ahead of the bottom of the pattern, whether that turns out to be a H&S or a descending triangle. They would then wait for a potential return-move that demonstrated the market had flipped, at which point everyone else would sell below that pattern, thereby pushing prices even further down.
Moderate traders - May be content with a close under the $37 round-number, below the pattern. They might also wait for a corrective rally, but only as a means for getting a better entry point, not necessarily for confirmation of the pattern.
Aggressive traders - May risk a short now, betting that the pattern top will maintain intact, provided they accept the risk of a blowout and are comfortable in losing that position.
Trade Sample – Aggressive Short
- Entry: $38.40
- Stop-Loss: $38.75, previous high
- Risk: $0.75
- Target: $36.15
- Reward: $2.25
- Risk: Reward Ratio: 1:3
Note: This is just a sample of a possible trade. Feel free to change the parameters according to your personal needs.
