COVID-19 has been very good to Netflix (NASDAQ:NFLX)—both the company and its stock. Faced with the prospect of indefinite lockdowns, people happily subscribed to the company's streaming entertainment offering. So as the global economy reopens, it stands to reason that some subscribers, free now to leave their homes, will likely close their memberships.
Investors too will probably shift their focus, from stocks set up to outperform in a locked-down world, to cheaper equities that underperformed while populations sheltered in place.
As well, Netflix's lingering issue of customer saturation may have gotten worse post-pandemic: anyone who hadn’t signed up before coronavirus, but was considering doing so, probably finally did. One could convincingly argue that at this point, whoever didn’t join the streaming site probably won't be doing so now (unless, of course a second wave materializes, which might change that equation).
Additionally, time isn't on Netflix's side as competition—from Disney (NYSE:DIS), Apple (NASDAQ:AAPL) and Amazon (NASDAQ:AMZN) among others—crowds the market and likely siphons off customers. And boosting prices to offset slipping cashflow—which could be an immediate solution—becomes increasingly more difficult in proportion to the rising competition.
Still, all isn't lost for Netflix. There remains a healthy potential market in broadband and device-only customers, many of whom are international. So, to be clear, we’re not saying the stock is a loser. We’re just waiting for better valuations.
A look at the chart can help determine our parameters.

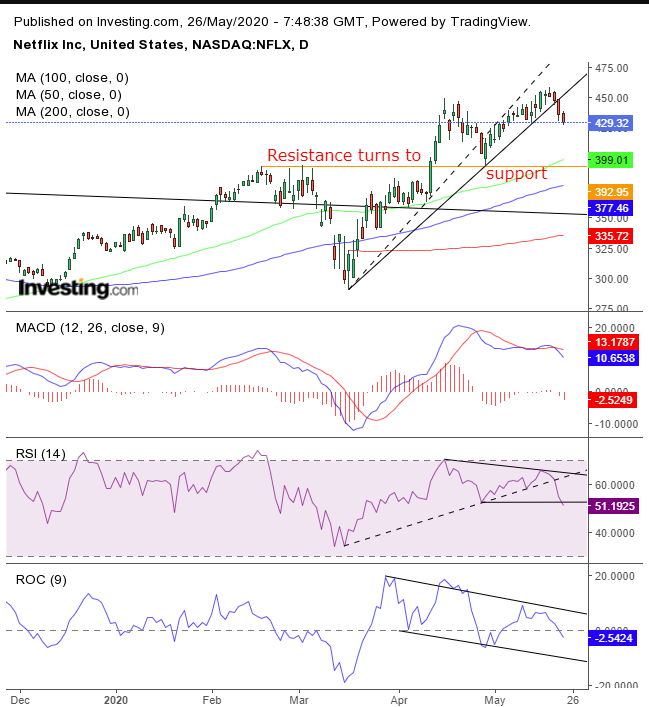
As of Friday, Netflix shares have been falling for four straight days. On Thursday and Friday the price crossed below the uptrend line since the March bottom.
This marks the second deceleration to the rally since April 28 (dotted line). While the trend remains up, with higher highs and lows, we're making a case that it's growing weaker. However, for now, we are just looking at a pullback, not a reversal.
The MACD’s short MA crossed below the long MA, a significant trigger after reaching the highest levels since January 2018. Indeed, this indicator is building the strongest case for a pullback in over two years.
Both the RSI and the ROC entered a downtrend, showing that a slower RSI confirms the more sensitive ROC in the momentum’s reversal.
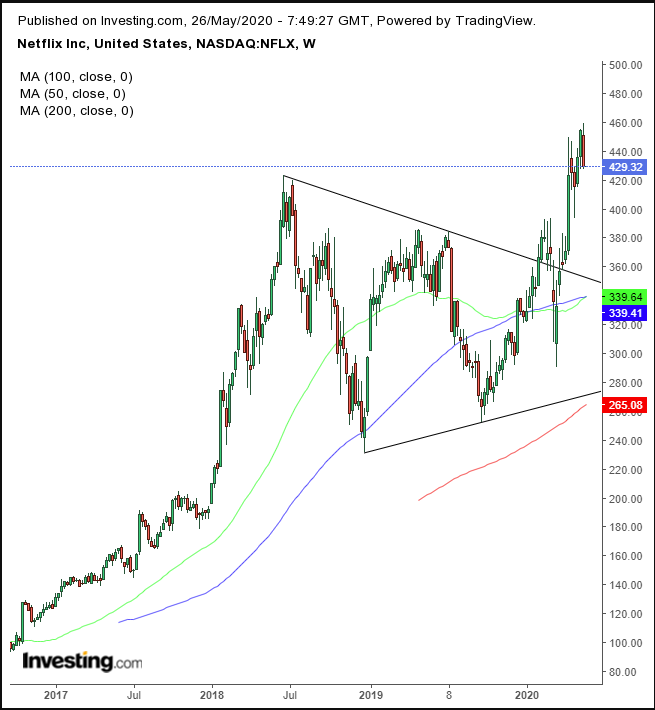
While we expect a decline, we recognize there's staunch support at the $350, as can be seen more clearly on the three-year weekly chart.

The price completed a sizeable symmetrical triangle, between June 2018 and March 2020, bullish following the preceding uptrend. A decline now, therefore, fits with the expectation of a return move to retest the pattern’s integrity.
Trading Strategies
Conservative traders are likely to wait for the price to bounce off the triangle, demonstrating support, and join the primary trend.
Moderate traders will ease into a position upon reaching the presumed support, but without waiting for confirmation.
Aggressive traders would probably ride the stock down.
Trade Sample
Entry: $450 – upon an exuberant, broader market rally, ahead of reopening economies
Stop-Loss: $460 – above May 19’s all-time high
Risk: $10
Target: $400 – psychological round number above the February highs, whose resistance turned to support in April
Reward: $50
Risk:Reward Ratio: 1:5
