This article was written exclusively for Investing.com
In recent days, US technology and growth stocks have underperformed with investors choosing the racier value stocks—those that tend to rely on economic growth. But after Thursday’s bullish price action, the tech sector could find renewed strength again as yields, including on the 10-year Treasury note, have fallen on the back of dovish remarks from several Fed officials who have moved to quell speculation over monetary tightening amid rising inflationary pressures.
On Thursday, the Dow rose to a record high as more economic signs of an improving economy emerged, with applications for unemployment benefits falling last week to a fresh pandemic low. But this didn’t prevent the tech-heavy NASDAQ making a nice comeback. Investors will be watching today’s monthly employment report, which is expected to reveal that around 1 million nonfarm jobs were added in April.
The key question is, will the NASDAQ be able to extend its gains even if today’s jobs data triggers a bond market sell-off and cause yields to rebound?
Remember, rising yields have not been a great sign for the over-stretched tech sector in recent past, so make sure you are taking extra care if you are going to be trading the NASDAQ or tech names today.

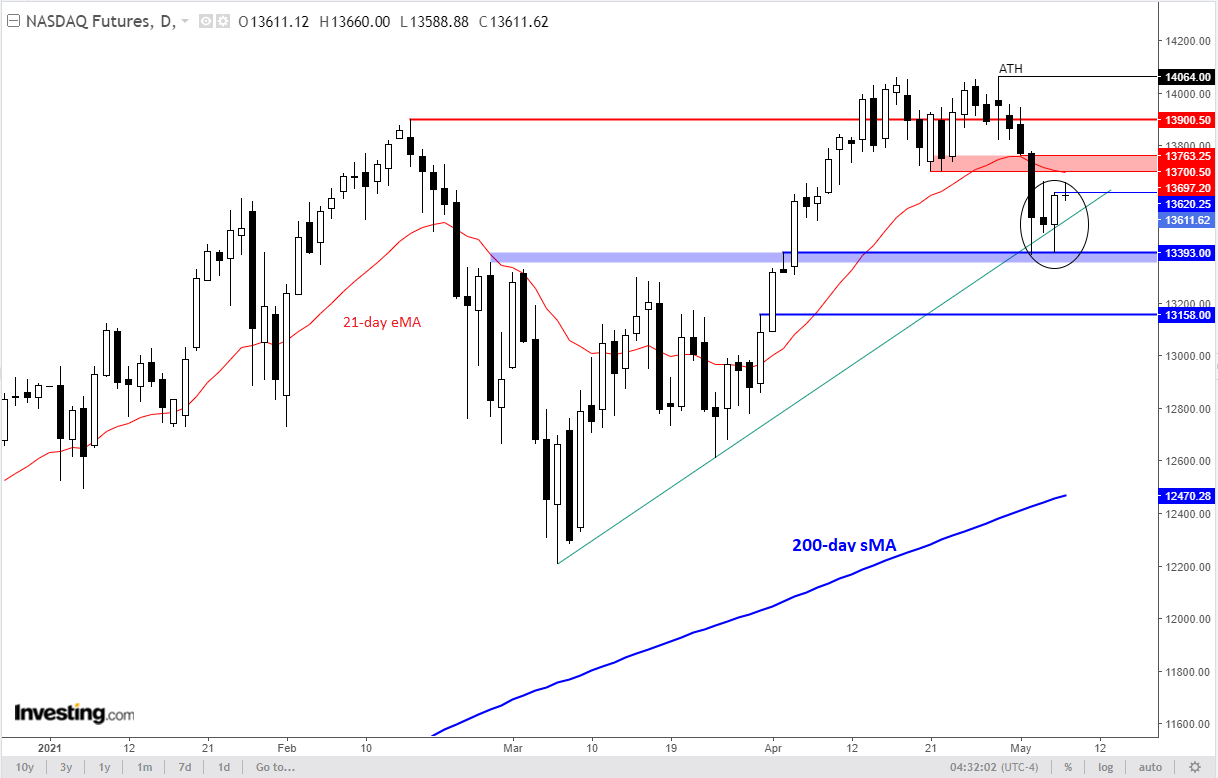
But as the above chart shows, the NASDAQ has managed to hold key support just below the 13400 area (shaded in blue), which was previously resistance. This area provided support not only on Thursday, but it is where the sharp sell-off on Tuesday had also ended. In other words, the index has formed a double bottom here, which suggests we may see further gains going forward for the technology sector.
Unlike the Dow, which closed at a record high as value stocks surged, the NASDAQ is still over 3% below its all-time peak around 14064. On the way to that target, there will be some levels that need monitoring, including the area shaded in red, between 13700 to 13765. This was the last support area prior to this week’s breakdown. Once support, it may turn into resistance on re-test from below. In addition, the 21-day exponential moving average also comes in here, making it a technically-important zone.
But given the double bottom formation and as the bullish trend line also held, not to mention the fact that the long-term trend is bullish, I would say the probability of the index breaking through the above resistance zone is higher than a sharp rejection there to send us to new weekly lows.
Still, if you are trading the NASDAQ or tech stocks today, it is definitely worth keeping a close eye on that potential area of resistance. If and when this zone is cleared, we could see the index make a run towards, and potentially beyond, its all-time high.
