US stocks on the S&P 500 briefly touched an all-time closing high yesterday, but finished just 0.2% below that level. The boost was largely propelled by surging heavyweight technology shares.
Facebook (NASDAQ:FB) jumped 3.75%, raising the social media giant's stock by 26.6% for the year so far. Apple's (NASDAQ:AAPL) shares were up 3.3%, bringing the iPhone maker's gains to a whopping 53.8% since the beginning of 2020. Shares of Microsoft (NASDAQ:MSFT) added 2.9% on Wednesday and +32.65% in 2020. Amazon (NASDAQ:AMZN) also gained yesterday, up 2.6% for a mind-boggling 71.25% acceleration this year.
Fellow FAANGer Alphabet (NASDAQ:GOOG), however, continued to underperform peers, both on a daily and year-to-date basis. The stock rose just 1.8% yesterday, bringing its YTD climb to a comparatively anemic 12.7%.
On Aug. 4, we published a post contrasting the two tech behemoths. At that time we focused on the superiority of Facebook’s business model over Google—and highlighted the technical outlook for FB shares which was bullish, as we correctly noted at the time.
In today's post, we'll zero in on GOOG.

Chart powered by TradingView
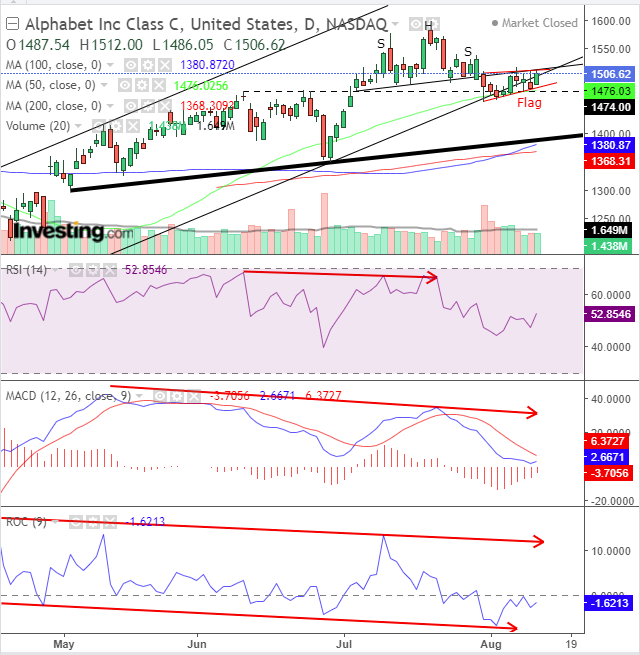
The stock completed a small H&S top by forming an immediate rising flag, bearish after the preceding reversal pattern. Note the flag developed above the June highs (dotted line).
A completed flag, with a downside breakout, as the initial H&S implies, would push prices down to the (thick) rising trendline since May 4, where the price found the support of a rising gap. If the price finds support at that trendline, it may develop the right shoulder of a proper-sized H&S top, whose head would consist of the entire, smaller H&S pattern.
Note that while the 50 DMA provides support to the flag and the smaller H&S, the 100 and 200 DMAs realigned with the potential neckline of the larger reversal pattern.
Of significance, the only volume spikes amid the development of the H&S structure since early May have occurred on red days, showing where the excitement—and therefore participation—truly lies, given the noise within the price action.
Finally, the RSI, MACD and ROC all provide negative divergences, showing that while the price accelerated, it did so with waning interest, making the stock a candidate for a dramatic correction, implying a return to the 1,200 level, which would put it in a bear market.
To be clear, the stock is still in a bullish trend. It would have to break down below the June lows to complete a reversal. We're merely pointing out that the stock is weak and might be turning lower shortly.
Trading Strategies
Conservative traders are likely to wait for the downside breakout of the larger H&S since May before committing to a short position, or go long on the pattern blowout when the price rises above $1,600.
Moderate traders would probably wait for the flag completion, playing off those dynamics.
Aggressive traders may very well short now, upon a return-move to the very neckline of the small H&S, providing an optimum risk-reward ratio.
Trade Sample – Aggressive Short
- Entry: $1,507
- Stop-Loss: $1,517 – above the Aug. 7, highest point of the flag
- Risk: $10
- Target: $1,427 – above rising trendline since May and potential larger H&S neckline and implied flag’s target
- Reward: $80
- Risk:Reward Ratio: 1:8
Note: This is a trade sample. It is not specific advice on a particular trade. If you didn’t fully read and understand this article, do not trade it. In addition, you shouldn't trade according to this one example. It's critical to adopt the core trade elements and reapply them to your timing, budget and risk tolerance.
