🐂 Not all bull runs are created equal. November’s AI picks include 5 stocks up +20% eachUnlock Stocks

Chart Of The Day: Gold's Symmetrical Triangle Suggesting More Upside Ahead

Published 12/02/2020, 12:27 am
XAU/USD
-
US500
-
GC
-
IXIC
-
DXY
-

Gold is declining on Tuesday, halting a four-day rally, after the S&P 500 and NASDAQ hit fresh records yesterday and all U.S. indices closed at the top of the session. Monday’s exuberance was especially surprising after the World Health Organization (WHO) statement about the potential spread of the deadly coronavirus.

So, how to reconcile this incongruity between the stark warning from the leading authority on this expanding geopolitical risk and the turn that investor sentiment has taken? Look at market mechanics.

The global financial market is like a complicated automatic watch, with multiple gears that affect one another. For example, while a dovish Fed supports record-high stock prices, the path to low interest rates also weighs on the U.S. Dollar Index, thereby boosting gold, whose value is not derived from its yield.

Moreover, even yesterday’s bullish performance in U.S. stocks could be a set-up for a reversal, a combination of long positions and unwinding shorts.

We have been bullish on gold since August — and we believe the precious metal still has ample room to gain further.
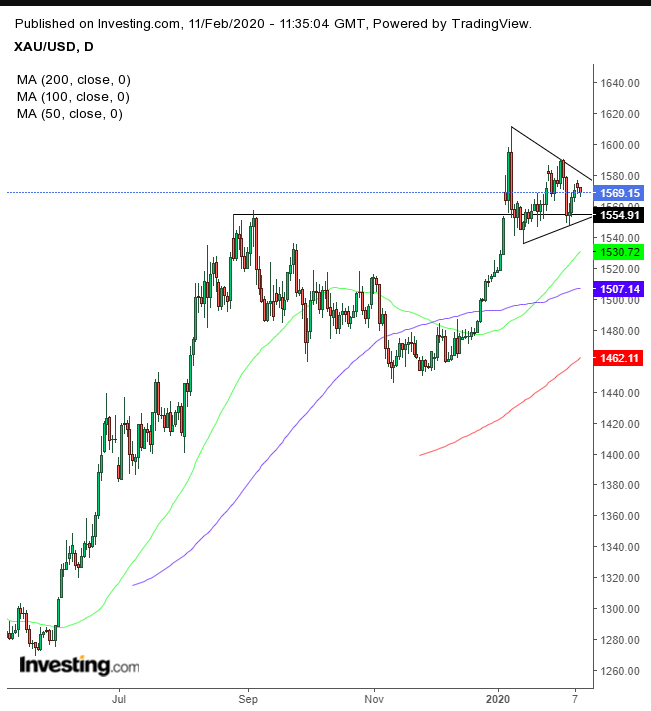
XAU/USD Daily Chart

So, what mechanics could cause gold to decline — other than the apparent risk-on in yesterday’s records? It just so happened that the trade followed the converging path of its symmetrical triangle.

This pattern's symmetrical design suggests a continuation to its preceding uptrend, whose location at the very top of the August-September highs makes this particular continuation trend especially bullish, upon an upside breakout.

Trading Strategies

Conservative traders should wait for an upside breakout with a minimum 3% filter, to minimize a bull trap. Then, wait for a pullback to retest the pattern’s integrity.

Moderate traders would wait for an upside breakout beyond $1,610, the highest point of the triangle, then for the return move for a better entry, not necessarily for proof of trend.

Aggressive traders may enter a long position at will, providing they can afford a stop-loss beneath the triangle.

Trade Sample

  • Entry: $1,560
  • Stop-Loss: $1,555
  • Risk: $5
  • Target: $1,575
  • Reward: $15
  • Risk:Reward Ratio: 1:3
  • Latest comments

    Loading next article…
    Risk Disclosure: Trading in financial instruments and/or cryptocurrencies involves high risks including the risk of losing some, or all, of your investment amount, and may not be suitable for all investors. Prices of cryptocurrencies are extremely volatile and may be affected by external factors such as financial, regulatory or political events. Trading on margin increases the financial risks.
    Before deciding to trade in financial instrument or cryptocurrencies you should be fully informed of the risks and costs associated with trading the financial markets, carefully consider your investment objectives, level of experience, and risk appetite, and seek professional advice where needed.
    Fusion Media would like to remind you that the data contained in this website is not necessarily real-time nor accurate. The data and prices on the website are not necessarily provided by any market or exchange, but may be provided by market makers, and so prices may not be accurate and may differ from the actual price at any given market, meaning prices are indicative and not appropriate for trading purposes. Fusion Media and any provider of the data contained in this website will not accept liability for any loss or damage as a result of your trading, or your reliance on the information contained within this website.
    It is prohibited to use, store, reproduce, display, modify, transmit or distribute the data contained in this website without the explicit prior written permission of Fusion Media and/or the data provider. All intellectual property rights are reserved by the providers and/or the exchange providing the data contained in this website.
    Fusion Media may be compensated by the advertisers that appear on the website, based on your interaction with the advertisements or advertisers.
    © 2007-2024 - Fusion Media Limited. All Rights Reserved.