The US dollar retains its hold on the position of global reserve currency for two reasons. For starters, the United States is considered the most financially stable country in the world, thanks to its political system and military might. As well, it's still the world’s largest manufacturer and was, for many decades, also the biggest global exporter.
However, in 2017 China became the world’s largest exporter, and Germany is now not that far behind the United States on this measure. All of which diminishes the need for such a high global quota of dollar reserves.
To that effect, in 2018 China launched oil futures contracts denominated in yuan, in part, to try and replace the US dollar’s currency reserve domination. For that matter, Germany's economic strength could end up powering the eurozone's single currency to reserve status in place of the greenback if current political instability in the US worsens or the Trump administration's propensity for trade wars escalates, perhaps acting as a catalyst for a global restructuring of commerce.
It's possible too, that since the Fed's unprecedented money printing is, well, unprecedented, it increases the risk of a financial meltdown, as people lose trust in a system that relies solely on trust, rather than gold—as has been the case since 1971—when Nixon abandoned the gold standard.
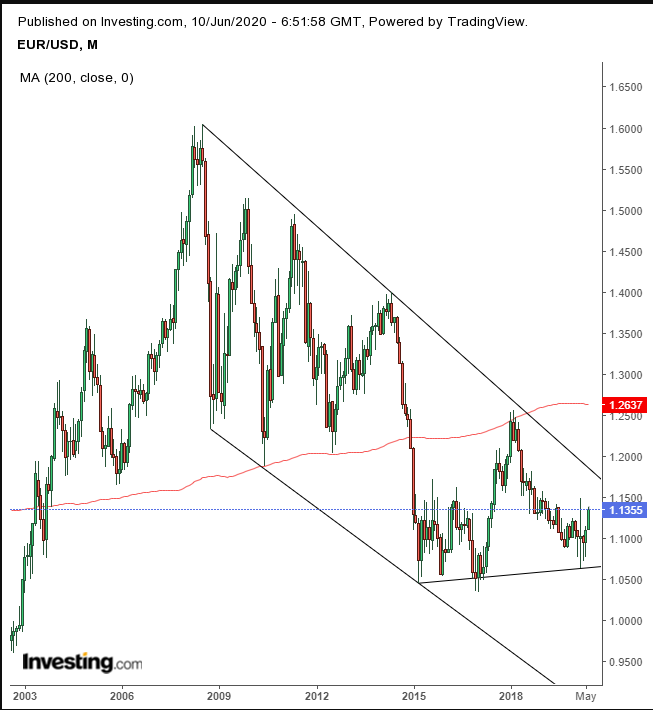
Right now though, the dollar still dominates. Even from a technical perspective, if there's a battle between the euro and the dollar, the long-term charts favor the USD.

The EUR/USD topped out in December 2014 when the pair fell below the monthly 200MA, which was the neckline of a massive H&S top. Since then, it has been trading within a falling channel, since the 2008 high.
Once again, the currency pair looks to be forming a H&S continuation pattern, which would be complete with a fall below 1.0500. Meanwhile, however, the euro is set to continue rising, in the short-to-medium term.

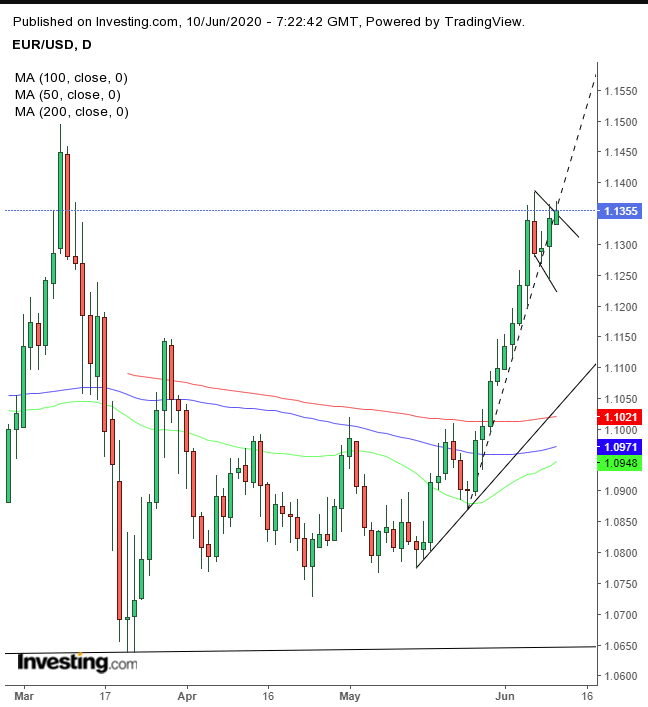
The single currency is climbing for a third day, after a one-day interruption to an eight-day winning streak, its longest since April 2011. However, such a strong rally is almost certain to be followed by profit taking—especially ahead of the resistance of the March 9 highs.
Therefore, when we note the downward slope that connects the highs reached on Tuesday and Friday, we expected the price to develop a falling flag. That's the pattern that develops when earlier bulls want to lock in gains, as new bulls arrive to pick up the load, for an expected next move.
Sure enough, even as we were writing this post, the price fluctuated, at times giving up session highs, forming an intraday shooting star. That's a bearish candle upon a close, but is more reliable when combined with the downtrend line of the recent highs.
That supports the scenario of a falling flag developing. If today's Fedspeak keeps focusing on accommodation, it could be the catalyst for another dollar selloff.
We also understand there needs to be a period in which the euro traders tackle the March 9 highs, likely leading to a pullback at the very least. Momentum indicators are also the most overbought since the March 9 highs, and falling, signaling that pullback. The slower, lagging MACD is the most overbought since January 2018 and is turning around.
Trading Strategies
Conservative traders would commit to a long position after an upside breakout of a minimum 5-session range, followed by a successful support retest on top of the pattern.
Moderate traders will wait for the breakout, followed by the return move as well, for the better entry though not necessarily for proof of trend.
Aggressive traders may enter a contrarian short, counting on a return toward the flag bottom, as overbought conditions settle.
Trade Sample – Contrarian, Aggressive Short Position
- Entry: 1.1355
- Stop-Loss:1.1375
- Risk: 20 pips
- Target: 1.1275
- Reward: 80 pips
- Risk:Reward Ratio: 1:4
