The dollar could be headed for a crash and it could happen very suddenly. So says economist Stephen Roach who believes it might occur at “warp speed.”
Roach, a Yale University senior fellow and former Morgan Stanley Asia chairman, sees the global pandemic as accelerating people’s “trigger responses." That, compounded by a “…massive shift to fiscal stimulus (that) is going to blow out the national savings rates and the current account deficit,” leads Roche to believe the dollar will soon collapse by 35%.
Exactly one week ago, we wrote about the dollar's momentum signals its move higher has run out of steam. The Dollar Index climbed for four straight days after that, albeit in a tight range.
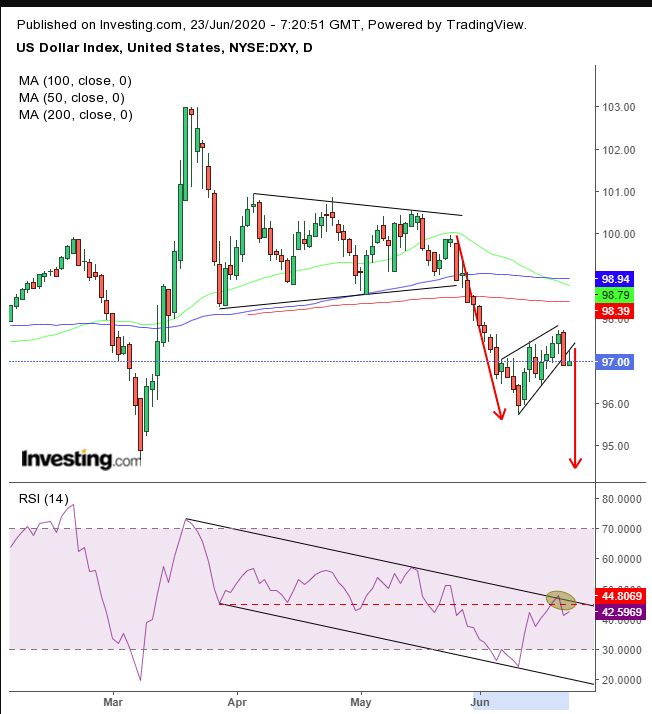
Yesterday’s drop erased three days' worth of that advance. Today, the greenback appears to have found its footing, edging higher. However, the last few days of trading have given rise to a bearish pattern on the charts, signaling a resumption of the downtrend.

The dollar completed a bearish rising flag after the sharp decline that was, itself, a breakout from the bearish symmetrical triangle pattern that formed following the drop in March and April.
The tightness of the range and the upward bias are both tell-tale signs of something other than a bullish pattern, which is how this move might look on the surface, given that the USD has been rising. The presumption is that of an intense exchange between buyers and sellers. However, even these buyers are probably actually sellers.
The dramatic 4% drop in two weeks had bears excited, but also second-guessing themselves: "maybe we got ahead of ourselves; it moved too far, too fast." In a rush to lock in profits, they unwind sell-positions, which increases pressure on the demand-side of the equation, causing prices to inch up. But who’s shorting?
The answer: traders that blinked with the first leg down from the symmetrical triangle. They must have been kicking themselves for losing such an easy win, promising themselves they’d be more alert, and quicker on the trigger if another such opportunity presented itself.
The flag formation is that period that includes all the soul-searching and all the stages of an emotional arc.
When selling pressure from new bears overwhelms demand in the form of short-covering by established bears, they must keep selling, even at lower prices, below the confines of the pattern. This is what causes the downside breakout.
When that happens, it's a signal to the existing bears that they were not wrong about the market after all, and that it wasn’t just a random move, but part of a bigger pattern. They then jump back in, pressing the accelerator and sending this instrument south.
The 50 DMA had already crossed below the 100 DMA within the development of the rising flag. Another leg down would push the 50 DMA further down, below the 200 DMA and forming a death cross.
The RSI also peaked, even before the price breakout, finding resistance at the top of its falling channel, marking a negative divergence to the symmetrical triangle. This gave technical traders a heads-up, ahead of the formation of the flag.
As far as the RSI is concerned, the instrument has completed a full return-move, as the momentum-indicator climbed back to the lows that correspond to those of the price pattern, while the price is 1.2% below the pattern.
Trading Strategies
Conservative traders would wait for the price to fall to the bottom of the flag, toward the psychological 95.00 mark, then wait for a likely return move to retest the flag, before committing to a short position.
Moderate traders might follow the same pattern as conservative traders, but they would likely wait for the corrective rally to determine a better entry-point, rather than to confirm resistance.
Aggressive traders may short at will, provided they know how to write a coherent trade plan and have the discipline to stick to it. Following is a sample of the parameters required for a trade. Traders can change any component to fit their preferences.
Trade Sample
- Entry: 97.00
- Stop-Loss: 97.75 – above the flag
- Risk: 75 pips
- Target: 94.75 – above Mar 9 low
- Reward: 225 pips
- Risk-Reward Ratio: 1:3
