After its economy slumped by 20.4% during the second quarter, some have been calling the UK “the sick man of Europe.” Indeed, it's the worst contraction on record for Britain, putting it in the deepest coronavirus fueled recession of any major global economy.
The Bank of England recently said the country is facing the worst recession in a century. That's an upward revision from its more dire, May prediction forecasting the worst economic crash in 300 years.
And yet, the pound sterling had its best quarter versus the US dollar in over a year, from April through June.
So what gives? Why would Cable outperform when its central bank is busy issuing ominous economic forecasts?
The pound started off from a much lower point because of a variety of woes related to the 2016 Brexit vote and continuing into the March COVID-19 selloff. All these factors contributed to the Cable falling harder than other major currencies—rendering it a bargain. As well, it was boosted by better-than-expected retail sales and services data, in addition to a reasonably good unemployment report.
The current, sharp dollar selloff also helped the ailing currency, plus Cable rose against both the dollar and the euro, as Brexit talks resumed, suggesting that some of the preceding downfall was just on Brexit woes, with any good news on that front rapidly priced-in by nimble traders.
Thus, a confluence of dynamics—relief at a lesser historic recession, better-than-expected data and progress on Brexit—appears to have removed shorts from the market, creating a short squeeze.
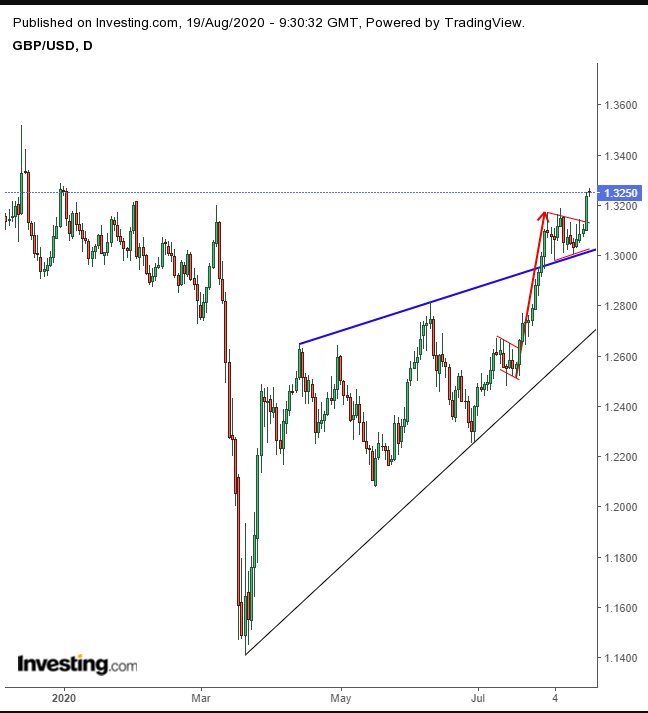
That reaction is more clearly visible on the technical chart.

In just the 11 sessions from July 17 through 31 the pound surged over 5.28%—corresponding to the rapid reduction in short positions. After that, the currency went through a rest period, in which it appeared to reached equilibrium with the dollar.
Only yesterday’s sharp, one-percent upside breakout dispelled that illusion. Demand absorbed all available supply within the pennant-shaped congestion, a continuation pattern, and charged through the roof, seeking more supply at higher prices.
This trading pattern presumably sets up a chain reaction—another short squeeze and triggered longs—to drive the pound even higher.
It’s noteworthy that the sterling already had another such rally, jumping over 6%, between May 18 and June 10, right after the BoE’s stark prediction of the worst contraction in 300 years. Of course, when bad news can’t keep an asset down, that's very good news for investors. Also, earlier, Cable bounced nearly 11% from the March bottom.
The overall trading pattern since the March lows, a rising wedge, is considered bearish following the 13.5% plunge seen from March 9 to 20, since bulls would have been expected to lose patience with the rally’s loss of momentum. However, the topside breakout blew out the bearish dynamics, turning positions on their heads, forcing rapid unwinding and even position reversals—which all pushed the pound higher.
This bearish pattern failure is bullish and connects the technical dots when the top of the failed rising wedge—a previous resistance—coincides precisely with the bottom of the pennant, a new support.
The RSI bounced back to the 76 overbought condition, after taking a breather from the 80 overbought level. While a return-move following the pennant breakout may push the RSI to the bottom of its rising channel, powerful rallies can also take place amid overbought degrees, and even stretch them out for a while. The ROC found support at a rounding bottom.
Despite the bleak economic outlook for the UK, traders are increasing demand for the country’s currency on a consistent and stable basis, which is why we believe it will keep climbing.
Trading Strategies
Conservative traders would wait for the price to overcome the Dec. 2, 1.3516 high and a trend reversal, before risking a long position.
Moderate traders will wait for a return move, whenever that happens, that would retest the broken wedge and complete the pennant’s combined support.
Aggressive traders would go long after writing a coherent trading plan that suited their personal budget and level of tolerance.
Trade Sample
- Entry: 1.3200
- Stop-Loss: 1.3100
- Risk: 100 pips
- Target: 1.3500 – round psychological number that provides resistance to the Dec. 2 peak
- Reward: 300 pips
- Risk:Reward Ratio: 1:3
Note: This is just a sample, not instructions for trading. The analysis is just a note on potential possibilities. If you don’t read and understand the post, do NOT trade. Even if you do, this sample is not tailored to anyone's personal needs. Feel free to tweak the numbers to fit your budget, timing and character.
