This morning, iron ore futures in China popped by as much as 3.6%, before closing at a more modest +2.6%. As the world's largest importer of the commodity, as well as, perhaps currently the world's most active builder, Chinese demand is pushing the base metal higher, causing it to flirt with the possibility of a new all-time high.
Meanwhile, in the background, regional trading partners Australia and China could be headed toward not just a trade war but a full fledged cold war. Tensions started back in 2018 when Australia was the first country to publicly ban Chinese behemoth Huawei Technologies from building the land down under's 5G network.
The already strained relationship worsened when Australia requested an investigation into the origins of COVID which was first reported in the city of Wuhan, suggesting China is to blame. Canberra has also stridently condemned Beijing's abusive treatment of the Asian nation's Uighur minority which escaltated tensions yet further. The situation has continued to spiral downhill, with Australia coming out against China's Taiwan reunification rhetoric.
Trade between the two countries has already slumped by 40%. However, China has yet to stop buying Australian iron ore, which is crucial for Chinese infrastructure rebuilding in the wake of the virus. If tensions should worsen, and China decided to shift its purchasing of the industrial metal to another source, expect wild price swings.
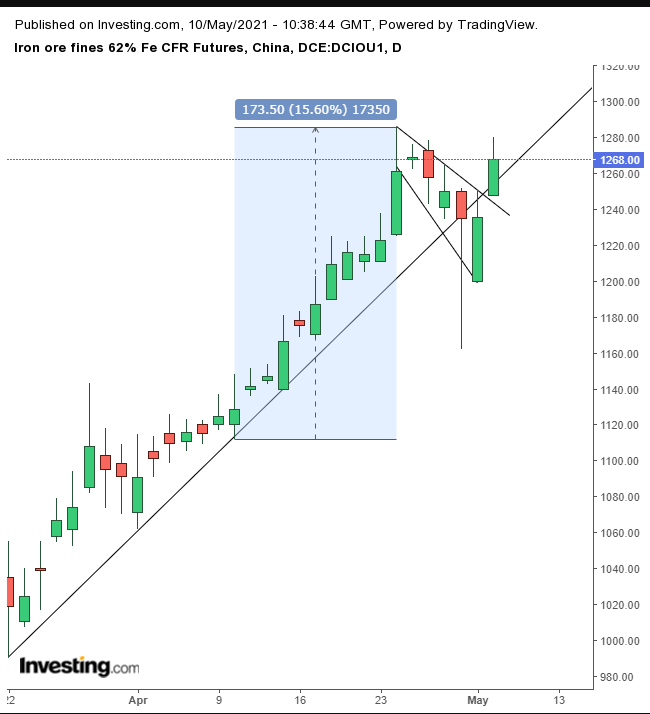
The chart is signaling the price of iron ore has more room to run.

The metal's contract completed a falling flag, bullish after the 15% surge during an 11-day straight advance. The flag’s upside breakout was clearly bullish, following an exceptionally powerful hammer, proportionate to the extremely long lower shadow. This boosted the price back above its uptrend line.
Flags are the technical illustration of a period during which a trend refreshes itself. This occurs when early bulls who are eager to cash out sell, allowing new still-hungry bulls to shoulder the burden of the next rally.
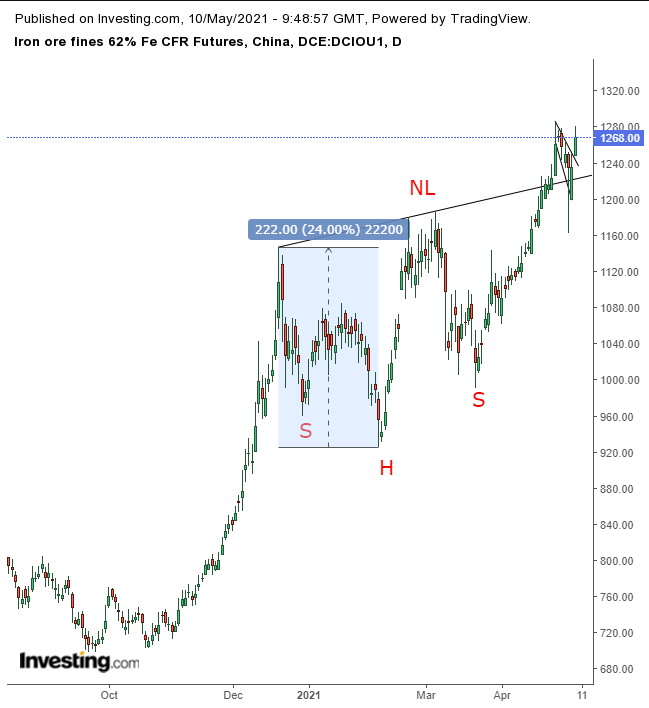
Here's why the flag developed just where it did on the chart:

The price completed a H&S continuation pattern. The upside breakout forced a short squeeze, pushing the prices further up. When all shorts were covered, the price languished.
The renewed jump demonstrates that there is still demand after the H&S completed.
Trading Strategies – Long Position Setup
Conservative traders should wait for the price to close above the flag and perform a return-move that would evidence demand above the flag.
Moderate traders would wait for the same pullback, for a better entry if not for further reconfirmation.
Aggressive traders could enter a long position at will, having accepted the higher risk of a potentially premature entry to correspond to the higher reward of being two steps ahead of the rest of the market. Money management is essential.
Here is an example of the basic components of a trade plan:
Trade Sample
- Entry: 1,250
- Stop-Loss: 1,225
- Risk: 25
- Target: 1,450
- Reward: 200
- Risk:Reward Ratio: 1:8
