Investor optimism boosted by unprecedented government stimulus measures gave birth to a new bull market for equities after the shortest bear market in history, barely three weeks long, ended recently.
But near-record gold prices — along with yields near all-time lows, unprecedented subzero oil prices and the worst jobs market since the Great Depression — may prove the current bull market was premature, if not stillborn.
Gold just hit a weekly high, but Bank of America had already set an astoundingly lofty price target for the precious metal: $3,000. That's significantly up from the bank's previous forecast of $2,000 and way beyond the $1,911.60 all-time high for the yellow metal posted in September 2011. BofA cited “financial repression” fueled by central banks as the driver, as well as a risk-off atmosphere caused by the turmoil in oil markets and across other recession-vulnerable assets.
While the threats to the economy and financial markets are certainly worrying, we can't know the future. Bank of America expects their target to play out over the next 18 months.
But keep in mind that everyone, including us, has been wrong at some point before about markets. So instead, we offer a more modest price objective, to be hit within a significantly shorter time frame.

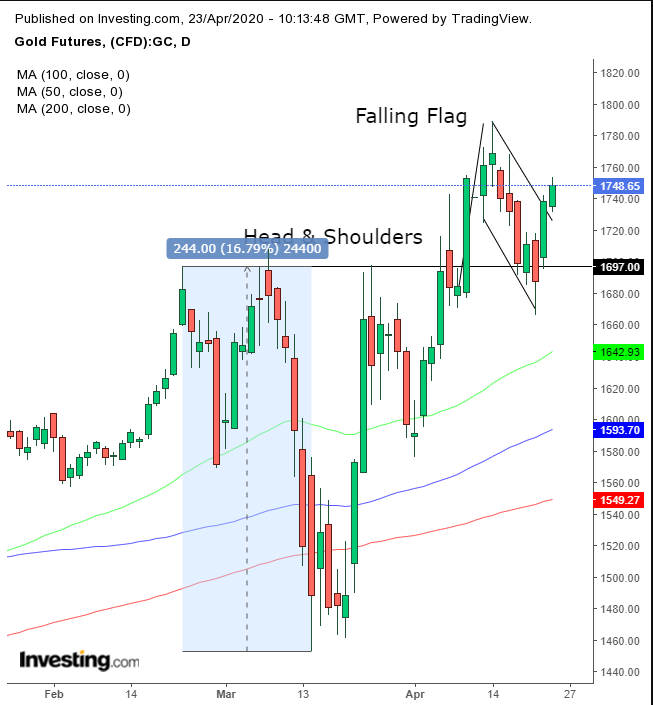
Gold futures completed a H&S continuation pattern (looks like a H&S bottom) — a bullish pattern demonstrating a positive reversal. The commodity completed a return move, in which it successfully retested the pattern’s support, showing that the supply-demand balance had truly reversed.
The return move that normally follows a breakout developed a continuation pattern of its own, a falling flag — which is a pause in an uptrend when new bulls come in to pick up the take-profit sales of the earlier bulls. The upside breakout reveals that all the slack that caused the range to tilt downward has been smoothed out and the market is in a position to resume its underlying uptrend.
Determining An Implied Target
The pattern’s implied target is discerned by measuring its height — $244 — and adding it to the $1,697 breakout point . This provides an objective of $1,941. Generally, the time frame is expected to keep in line with the setup. Since the pattern started on Feb. 24 and broke out on April 9, the follow-up is presumed to take about seven weeks.
Having said that, this supply-demand structure may fluctuate, and even break down, in the case of a yet unknown event or fact that was excluded from the making of the pattern. Also, we may expect whipsaws that could smack traders out of positions, before resuming toward the objective.
Trading Strategies
Conservative traders might wait for the flag to demonstrate that its breakout is no bull trap, after making a new high, past the $1,788.80 pinnacle registered on April 14. They would then await a pullback that demonstrates support.
Moderate traders would follow the conservative traders' path, but not necessarily wait for proof of trend.
Aggressive traders may wait for a 1.00% penetration above $1,760, to limit the risk of a false breakout.
Trade Sample
- Entry: $1,740 – upon a dip
- Stop-Loss: $1,730 – flag support
- Risk: $10
- Target: $1,780 – below the April 14 high, a potential resistance
- Reward: $40
- Risk:Reward Ratio: 1:4
Note: A trade sample is a device to convey the key components of a coherent trade plan. Not every trade can win. No trade is suitable for all traders. Feel free to change the entry points, stop-loss and target per your temperament and capital, but you must trade according to your preset plan, or your trade results — good or bad — will be meaningless.
