Two positive reports have helped Bitcoin rebound from its $7,375 low earlier this morning, erasing most of today’s losses.
Echoing Twitter (NYSE:TWTR) founder Jack Dorsey's recent comment that he hopes Bitcoin might become the internet's "native currency," yesterday, Apple (NASDAQ:AAPL) co-founder Steve Wozniak told CNBC that he too hopes Bitcoin will become the single global currency.
Further boosting the most popular cryptocurrency by market cap, a Russian city court in St. Petersburg overturned a 2016 decision that effectively blocked a crypto-focused website from being used by Russian residents. It's a clear signal the country can support cryptocurrencies.
However, technical analysis indicates a higher likelihood that Bitcoin's slide will resume.

Indeed, as the day progressed the cryptocurrency's price started falling again, as the overall technicals overcame the positive fundamentals.
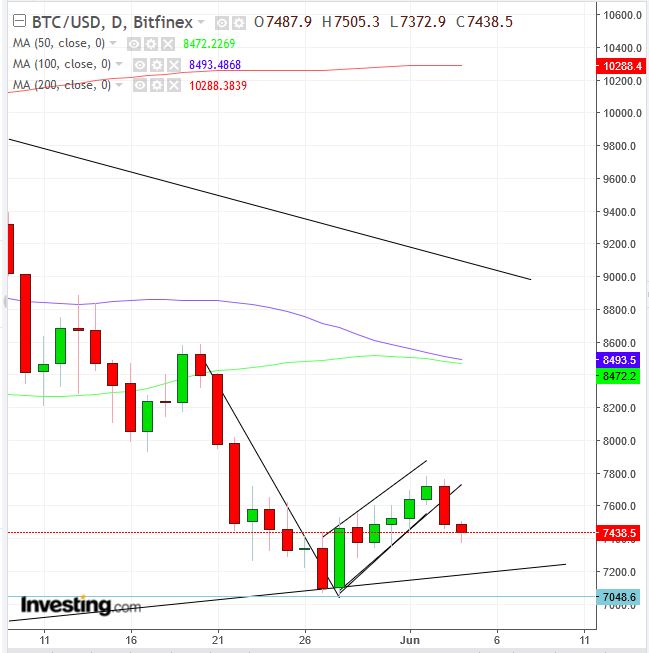
Today's decline completed a bearish, rising flag, in which traders ended a 7-day consolidation of profit taking and after some soul searching a majority voted to continue selling. The pattern's implied target, obtained by measuring the "flagpole," the preceding $1,5000 decline between May 20 and May 27, eyes the $,6000, February 5 low.

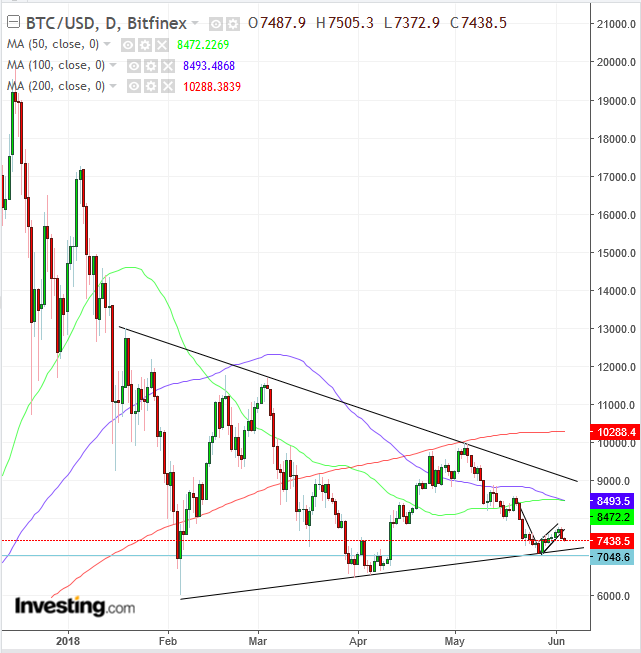
If that’s not bad enough news, that decline would break out of a much larger symmetrical triangle since January 19, implying a much steeper and longer drop.
As well, while the 200 DMA (red) kept the May rally within the triangle and is now guarding its upper boundary, the 50 DMA (green) hit on the bottom of the 100 DMA (blue) and turned lower, demonstrating that more recent price data is weaker than older metrics.
Trading Strategies – Short Position Setup
Conservative traders might wait for a breakout of the symmetrical triangle to gain clarity on the trend, prior to entering a trade.
Moderate traders may wait for a pullback, in order to find a better entry.
Aggressive traders may enter a short position now, provided they can afford a stop-loss above the $7,778 flag top/Bearish Engulfing pattern, or the risk of losing the position.
Equity Management
Just as important as sound analysis, if not more so, is equity management.
No one knows the future. Technical analysis simply attempts to maximizing probabilities. Equity management helps a trader stay on the positive side of statistics. Therefore, incorporating the analysis with equity management that provides at least 1:3 Risk-Reward ratio works in your favor.
Trade Example:
- Enter: $7,400
- Stop-loss: $7,800
- Risk: $400
- Target: $6,200
- Reward: $1,200
Risk-Reward Ratio: 1:3
