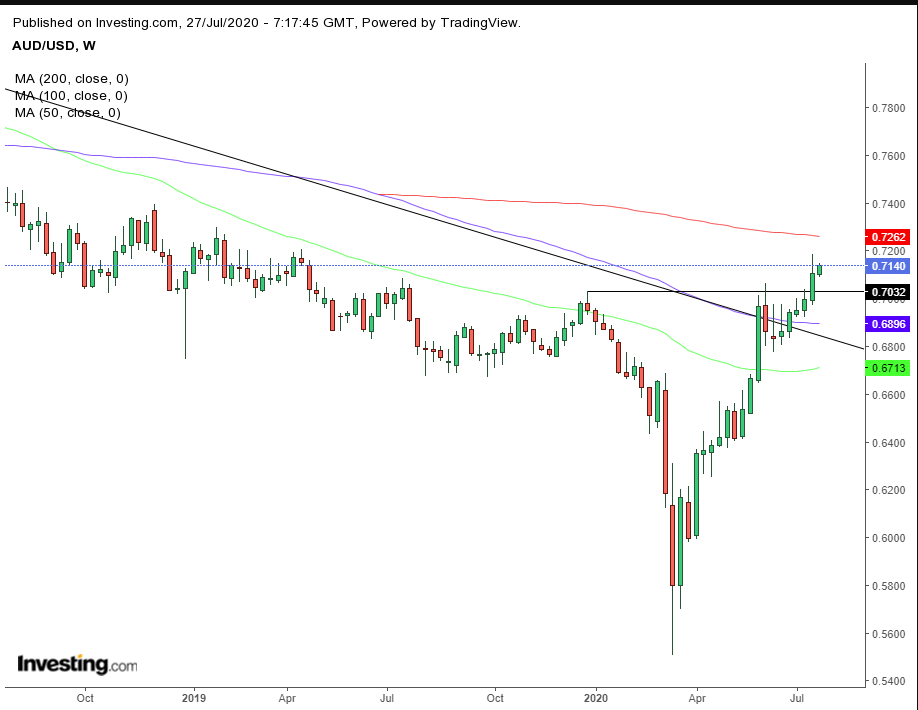
The Australian dollar has flown to a 15-month high, thanks to a number of factors that have created a powerful tailwind.
First, is the risk-on trade that has brought global equities to the levels seen before the coronavirus pandemic erupted pre-covid levels, at the expense of the US dollar, which in turn has brought record-low yields and record highs for gold. That’s the narrative, whether justifiable or not.
Second, the Federal Reserve is out-printing the Reserve Bank of Australia, diluting the value of each US dollar.
Third is an expectation that Australia will recover more quickly than the US.
The record-high in gold above $1,930 an ounce has buoyed the Aussie dollar. As the world’s third-largest gold producing country, the currency from Down Under has an 80% correlation with the price of gold. The more people pay for gold, the more people have to buy the AUD with which to pay for Australian produced gold.

In late June the Aussie dollar crossed above the downtrend line and the top of the falling channel that has formed since Apr 2013. Last week, it rose above the highs registered in December, thereby completing a V-shaped reversal.
On the daily chart, the 50 DMA crossed early in the month above the 200 DMA, triggering the famous Golden Cross, while on the weekly chart, the price already crossed over the 50 week MA—which has served as resistance since March 2018—in early June, and above the 100 week MA, which had been tracing the top of the channel since April 2019. The AUD/USD is now eyeing the final, 200 week MA, which is around 1.8% above. As the AUD/USD is climbing for its sixth straight week, the more significant MA can provide the pretext for profit-taking, setting up the V-shaped return move.
Trading Strategies
Conservative trades would wait with a long position for a complete return move to the broken channel top, followed by evidence of demand, which would prop up the price after the pullback.
Moderate traders might be content with a dip to the round, psychological 0.7 number which coincides with the V bottom neckline, if it provided support. Otherwise, they’d wait for a fuller pullback toward the channel top, for a better entry but not necessarily for proof of trend.
Aggressive traders may risk a contrarian, short position, before joining their more patient counterparts. Only consider this trade risk, if you understand the post fully, the risk of the trade and can withstand the potential loss financially and temperamentally.
Trade Sample—Aggressive Short Position
- Entry: 0.7150
- Stop-Loss: 0.7190, above Wednesday’s shooting star
- Risk: 40 pips
- {0|Target}}: 0.7030 – Neckline
- Reward: 120 pips
- Risk-Reward Ratio 1:3
