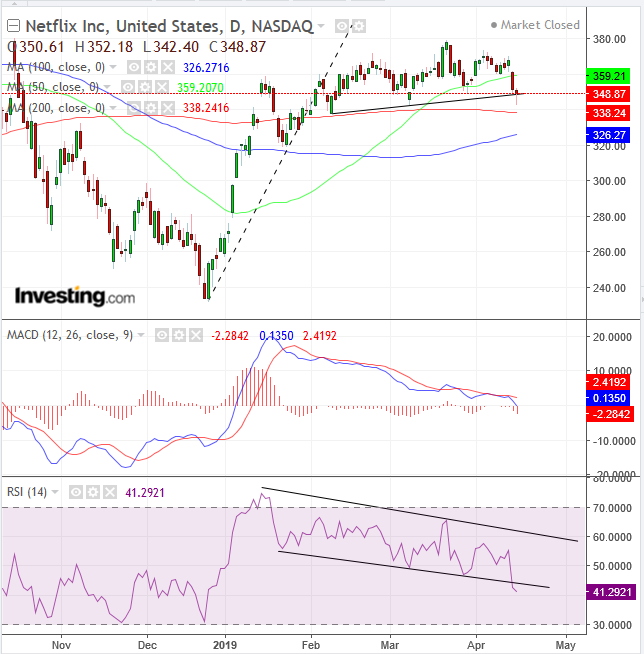
Netflix (NASDAQ:NFLX) shares plunged on Friday, after Disney announced details of its new streaming service, Disney+, firing up concerns about increasing competitive risk. The original streaming giant reports earnings today, after market close. Will the results help reassure investors, or drive more of them away? The chart below suggests the latter is more likely.
Analysts expect EPS of $0.57 on revenue of $4.5 billion, up from the $0.64 EPS and $3.7 billion revenue for the same quarter last year. While the company missed EPS forecasts only three times in the last 4 years, it's fallen short of revenue estimates on ten occasions during the same period. However, some of the most closely watched metrics will be around subscriber growth. Netflix added 30 million net new subscribers last year, and analysts expect recent additions to stay around that number.
But can the company maintain that pace, with Walt Disney (NYSE:DIS) joining Apple (NASDAQ:AAPL) in launching subscription services this year? Netflix dropped 4.49% on Friday, on very heavy volume. Yesterday, it suffered another 0.65% setback. This may be a knee-jerk reaction, according to some analysts: Netflix doesn’t expect the newcomers to provide significant competition to its tight hold over the streaming market.
Ironically, the company’s success may also be its catalyst for a failure: market saturation.The shares are up about 36% this year, more than double the S&P 500's 17% gain. However, the technicals are flagging a stark warning sign for the stock.

The price has been developing a Head & Shoulders top since February. Yesterday’s trading pushed it below the neckline, but it managed to close right above the line, forming a hammer, after the intraday low neared the 200 DMA – after the price fell below the 50 DMA - which is forming its own organic neckline.
Note, the price climbed above the major MA, along with the short-term uptrend line since the beginning of the year. However, that same uptrend line turned into a resistance after a shooting star developed on Feb. 5, to reinforce a previous shooting star that developed on Jan. 16.
Both the MACD and the RSI are in agreement in their bearish posture, which is rare — the MACD’s MAs render it a lagging indicator, while the RSI’s momentum gauge make it a leading indicator — as momentum is expected to lead price, which makes up the MACD’s MA.
The MACD’s sell signal is compounded by both the short MA finding resistance by the long MA, as well as both falling below the zero line.
The RSI is providing a triple sell signal: (1) descending channel, (2) provides a negative divergence with the up-sloping H&S and (3) the momentum-indicator fell below the descending channel’s lower boundary.
However, the hammer, above the 200 DMA, with the close above the neck line, suggests that not all demand has been absorbed, and a close below the 200 DMA would significantly increase the pattern’s bearish integrity, dramatically reducing the potential for a bear trap.
Trading Strategies
Conservative traders should wait for a close below the 100 DMA, currently at $326.27, with an upside return move that confirms resistance, with at least one long, red candle engulfing a green or small candle of either color.
Moderate traders would wait for a close at least below the 200 DMA, at $348.87, with a pullback for a better entry, not necessarily for proof of pattern.
Aggressive traders may short if the price rebounds toward the 50 DMA, at $359.21.
Trade Sample
- Entry: $359
- Stop-Loss: $360
- Risk: $1
- Target: $350, above neckline support
- Reward: $9
- Risk-Reward Ratio: 1:9
