Amazon (NASDAQ:AMZN) is due to reveal its Q1 2020 report card for the fiscal quarter that ended in March on Thursday, April 30 after market close. The mammoth online retailer has accomplished what few other companies have managed — it's seen its shares soar to all-time highs in a world shut down by the coronavirus pandemic.
While other business are laying off workers, to the tune of 22 million jobless claimants, a scale not seen since the Great Depression, Amazon has had to hire an additional 175,000 workers since the start of the crisis in order to keep up with soaring demand from people stuck at home.
Indeed, the king of e-commerce has effectively administered a death blow to many brick-and-mortar retailers that have been shuttered during the lockdown, some of which will never reopen, thereby increasing Amazon’s kingdom aka market share, even further.
While we view the stock as a buy—the long-term chart supports the fundamentals—shares closed down 2.74% yesterday, at $2,328, we'd advise waiting for a better entry point.

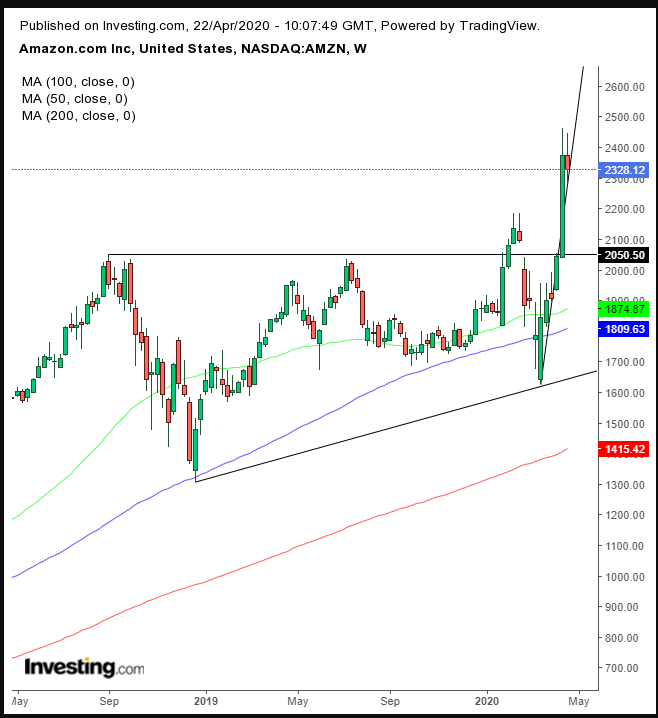
The stock completed a massive, long-term ascending triangle whose bottom was the infamous December 2018 rout.
Some analysts have set their price target for shares as high as $4,000. We’re aiming for $2,700, the implied target of the bullish pattern, based on its height. The assumption is that the pattern is like a coil. The more it contracts, the more powerfully it will bounce.
At the current price, all interested parties have already made their moves.
Human nature being what it is, both the winners and losers will have regrets. Indeed, even winners regret not having more conviction in their positions. After all, profits could have been so much higher had they increased their holdings.
As such breakouts are almost always followed by another move. Market repositioning, however, has the price retest, in this case, the support of the pattern at $2,000.
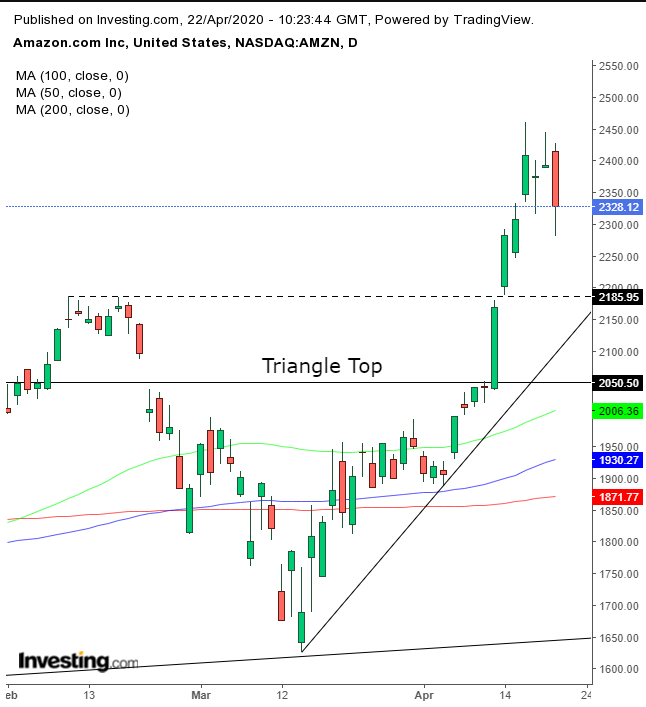
We can attempt to determine an appropriate entry point based on the daily chart.

Ideally, the price would return to the pattern top at the $2,000 area. However, unless another black swan occurs, this is unlikely. The $2,200 level — where the uptrend line meets with the triangle’s false breakout, the February highs prior to the pandemic selloff — looks promising.
Trading Strategies
Conservative traders would wait for the price to return to the $2,000 levels, seek signs of accumulation, before risking a long position.
Moderate traders would jump in either on signs of demand by the $2,200 level or by a return to the triangle top.
Aggressive traders may risk buying at the $2,200 level.
Trade Sample
- Entry: $2,200 – upon reaching the point where the February highs meet with the uptrend line
- Stop-Loss: $2,050 – the pattern’s presumed support
- Risk: $150
- Target: $2,650 – below the pattern’s implied target
- Reward: $450
- Risk:Reward Ratio: 1:3
