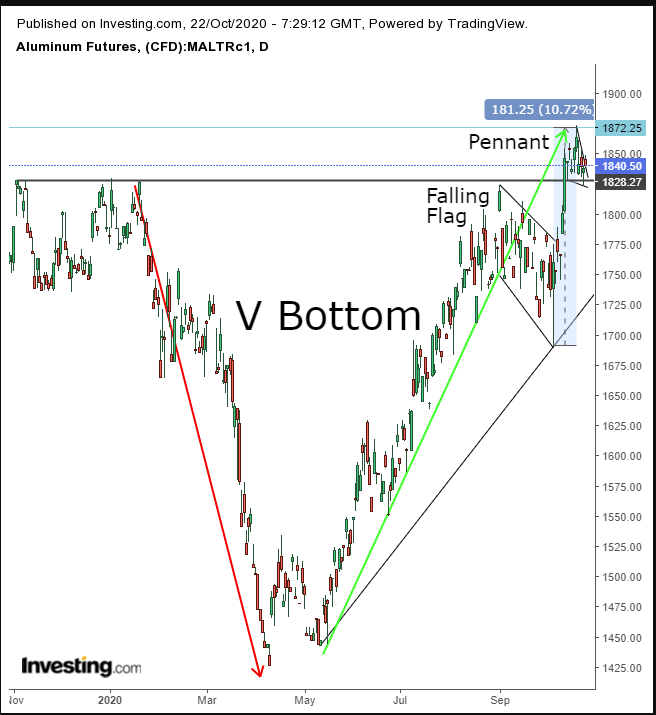
Aluminum hovers near an 18-month high boosted by China’s increasing demand as its economy recovers.
Barani Krishnan forecast that “despite its recent rally, aluminum’s technicals suggest it may still have some upside to offer.
He added:
"from a technical perspective, Investing.com’s Daily Outlook has a “Strong Buy” call on three-month aluminum, with a peak upside of just under $1,873 a tonne."
Aluminum hit that target on the nose—registering a high of $1,872.25, not three months, but two days later.
We saw that price target and we’re raising it. We expect to see the contract take on the $2,000 level within the month, and here’s why:

The trading pattern in the last 10 sessions is developing a bullish pennant—upon an upside breakout—following the 10% surge Oct 2-16. The current congestion is caused by an intense exchange between buyers and sellers.
If we’re right, the sellers are bulls who feel dizzy after the preceding spike and want to secure their winnings. Naturally, the buyers are bulls, who may be kicking themselves for missing such a windfall. So, we believe that we have here a case of bulls and bulls, which makes for a bullish picture.
We expect the pennant to complete with an upside breakdown, given that the preceding surge was itself an upside breakout of a bullish flag.
The flag developed below the November highs, as the trend needed new blood to absorb the supply by traders who remember the fantastic 22% plunge till early April and may fear an encore. Indeed, the flag allowed fresh bulls to charge and carry the prices above those November highs, completing a 10 ½ V bottom. This suggests that the rally from the depts of the April low of $1,400’s is just the beginning.
Piecing The Puzzle
Now, let’s put all these patterns into a single, cohesive picture: (1) flag to bolster move to overcome resistance (2) completing a V Bottom and (3) the breather in the form of a pennant following the exertion.
The falling flag was like a high-jumper taking a few steps back to pick up momentum before a jump, which is what gave the contract the momentum to break through the November resistance, completing the 10.5-month long V bottom.
The pennant is the rest after the jump—and if buyers absorb all the available demand within the pennant and want more, they’d have to increase their bids to find new willing sellers at higher prices, completing an upside breakout and signaling a resumption to the underlying rally.
Trading Strategies
Conservative traders should wait for a decisive upside breakout, with at least one, long green candle that makes a new high and wait for a return move to retest the pattern.
Moderate traders could wait for the same decline but to buy the dip, not necessarily for confirmation.
Aggressive traders may open a small position now, beating the crowd and getting ahead of the curve, betting on the upside breakout, provided they understand and accept the risk. Money management and ironclad discipline is key.
Here’s an example:
Trade Sample
- Entry: $1,840
- SL: $1,830
- Risk: $10
- Target: $1,870
- Reward: $30
- Risk-Reward Ratio: 1:3
