Facebook (NASDAQ:FB) reports first quarter earnings after market close on Wednesday, April 24. Expectations are for an EPS of $1.61, down from the $1.69 for the same quarter last year, on revenue of $14.97 billion – dramatically higher than the $11.97 billion reported for Q1 last year.
The social media giant has beaten EPS expectations since at least October 2013, and has missed revenue estimates just three times in the same period. This powerful performance has propelled the company's shares to gains of more than 100% since Facebook went public on May 18, 2012. And while the stock plummeted along with the rest of the market at the end of 2018, shares since recovered more than 38% to close yesterday's session at $181.44.
Contradictory messages from the technicals mean future direction of the stock isn't as clear-cut as we might wish. However, hidden beneath the noise, we're seeing convincing signals that the stock's direction may remain an upward one.

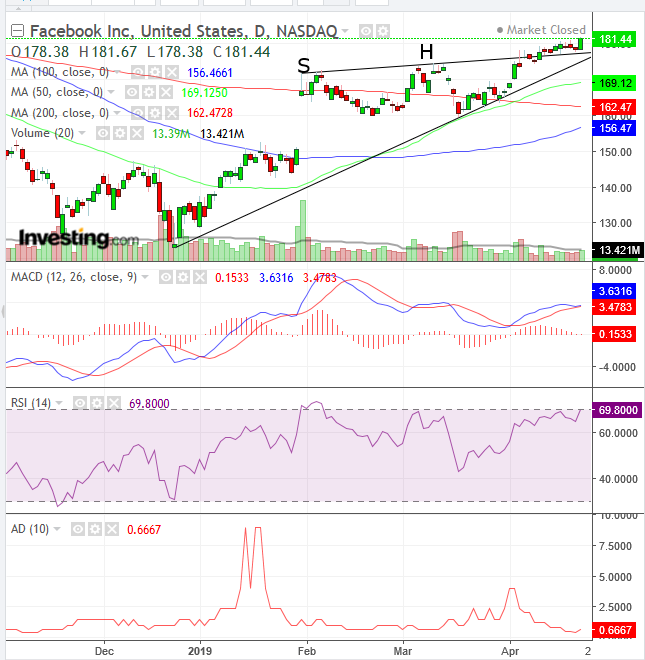
Facebook’s chart reveals an intriguing dynamic, in which bulls have been displaying weakness amid a market beset by low participation — as measured both by volume and breadth, both of which provide negative divergences to the rising price. Also, momentum seems to be stalling as it reaches overbought levels and meets the resistance of previous momentum highs, in early March, and before that, early February.
The shares saw a positive development on Thursday, when the price jumped from $178.38 at the open to $179.25 at the close. Most interesting was that the climb was supported by the highest volume since April 9, suggesting interest in the stock, even if less so in the broader market.
Earlier, the stock had been displaying weakness, first with a March peak that barely climbed above the preceding one posted in February. Then again, when the price languished from April 3, as that day’s shooting star provided an omen of weakness ahead.
However, prices managed to climb above the resistance on April 12, which pulled the 50 DMA above the 200 DMA, triggering a golden cross. The price managed to remain over the resistance, even if barely and moving sideways, till Thursday’s solid green candle.
That dispelled two potential bearish patterns, a Head & Shoulders top and a rising wedge. The first simply tracks a gradual turn-around of supply and demand. The second projects a frustration by bulls who lose patience as gains gradually shrink.
Whatever the dynamic, both are bearish. The fact that prices broke free of these patterns, however, is considered bullish, as the bearish implications of the developing patterns may have set up a major bear trap, with a short squeeze, and triggered long positions.
Trading Strategies
Conservative traders would not trade ahead of earnings, to avoid any unpleasant surprises.
Moderate traders might risk a position if prices today close higher, especially if the broader market displays weakness, setting FB up as a haven stock.
Aggressive traders may enter a long position now, providing it fits their account management.
Trade Sample
- Entry: $180
- Stop-Loss: $175
- Risk: $5
- Target: $195
- Reward: $15
- Risk-Reward Ratio: 1:3
