Apple (NASDAQ:AAPL) releases its second-quarter corporate report card after market close today. Analysts predict the iPhone maker will post EPS of $2.37 on revenue of $57.58 billion vs last year's $2.73 EPS, that beat its $2.69 estimate. But it slightly disappointed on revenue, posting $61.14 billion, just off the $61.15 billion expectation. While the company has missed the occasional revenue forecast, it has beaten EPS expectations 21 times out of the last 22 quarters.
However, EPS is not always enough, and revenue woes can hit a stock hard, as Google’s Alphabet (NASDAQ:GOOGL) showed in yesterday’s aftermarket and today’s pre-market.
Technically, we are seeing similar weaknesses in Apple's charts to those we saw in Alphabet’s.

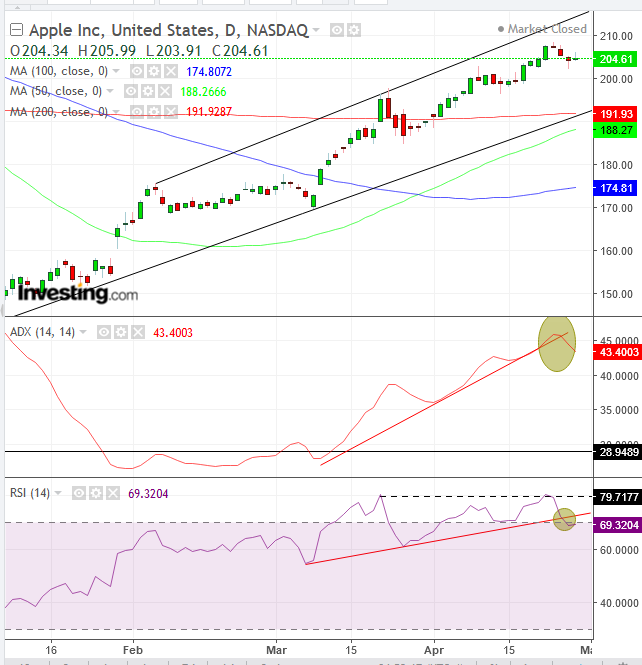
The price has been trading within an ascending channel, with the 50 DMA gaining on the 200 DMA, and on course to trigger a golden cross. Meanwhile, however, Wednesday’s shooting star signaled a slump, after nearing the channel-top.
Confirmation for at least a correction to the channel-bottom comes both from the ADX as a MA-based trend-strength indicator, as well as by the more popular momentum-based RSI, after reaching the extreme oversold level of 80 for the second time in as many months.

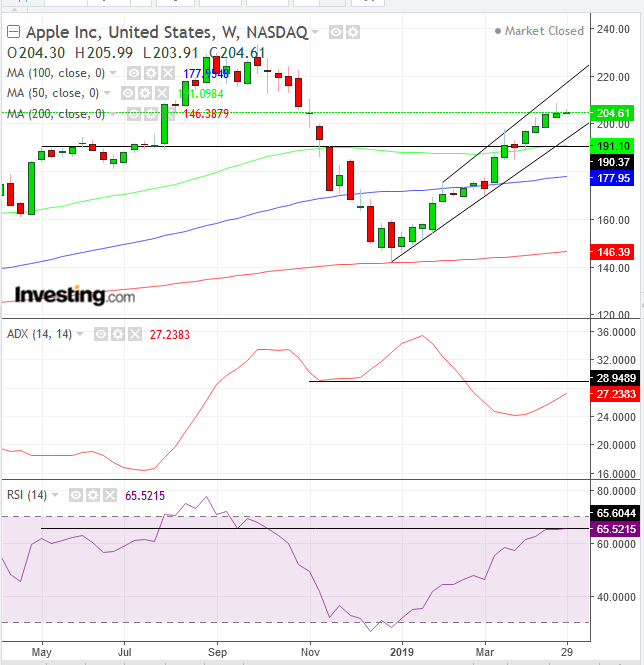
In the weekly chart we see an interesting negative correlation between the lagging price-based ADX indictor and the leading momentum-based RSI. The RSI has flattened at its own resistance level — below the late-August peak and above the May-June peaks — in a negative divergence to the price that has climbed above it for four weeks. That price advance has weakened with last week’s shooting star that reinforces Wednesday’s daily shooting star.
In contrast to the RSI’s plateauing, the ADX keeps climbing, reflecting the increasing strength of the current uptrend. However, note that it is approaching the November-December low. Will that act as a resistance — presuming the usual flipping psychology that takes place when a price returns to a previous point of failure? If investors will in fact increase supply, that would coincide beautifully with the heads up of weakening momentum the RSI has been providing us in the last two weeks.
Therefore, we expect a pullback at least to the channel’s bottom, which is supported by the 200 DMA.
Trading Strategies
Conservative traders should wait with a long-position for a return move to the channel’s bottom, or for the upper boundary of the channel to blow out, with a return move to demonstrate support above the pattern.
Moderate traders might buy into a pullback toward the channel bottom, for a better entry but not necessarily for proof of the pattern’s integrity.
Aggressive traders may short either with a return move to Wednesday’s shooting star or below yesterday’s low.
Trade Sample - Short
- Entry: $205
- Stop-Loss: $206, above yesterday’s high price
- Risk: $1
- Target: $202, yesterday’s low
- Reward: $3
- Risk-Reward Ratio: 1:3
