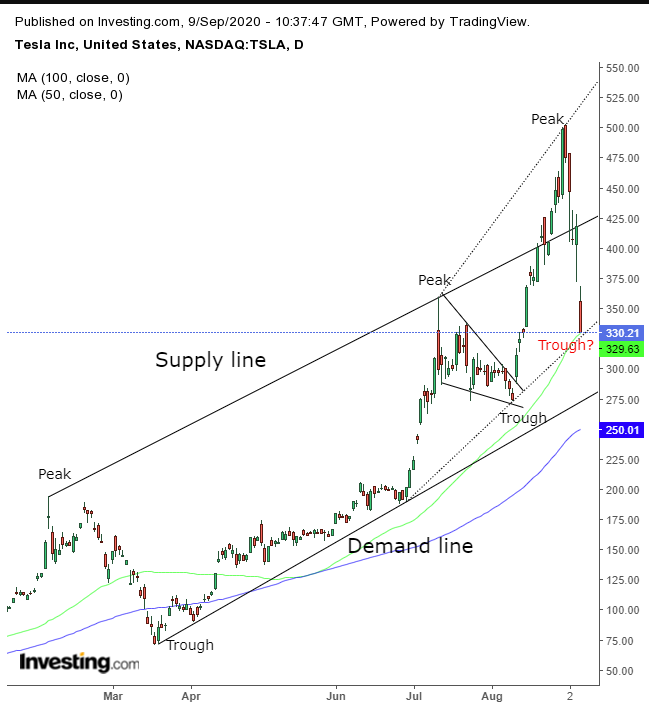
Since its Aug. 31 record peak, Tesla (NASDAQ:TSLA) shares have been in a serious downward spiral. Yesterday, the stock dropped 21.1%—it was the single worst day ever for the equity.
That one-day selloff would be enough to put the stock in a bear market. However, Tuesday's dive occurred on the heels of three days of additional selling, putting the stock 33.8% below its Aug. 31 record peak of $498.32 (the 5:1 split adjusted price).
The selloff is occurring amid a perfect storm for Tesla, in its capacity as a prominent member of the already troubled tech sector which is currently being dumped by investors, but also after it was rejected by the S&P 500 when the index rejiggered some of its listed companies on Aug. 31.
Not being carried in the SPX doesn't seem like that big a deal though. But not being included on the benchmark that lists some of the US's biggest companies means that fund managers tracking the broad index would be forced to buy Tesla on its own, if they wanted to buy it at all.
It seems that investors had already priced in Tesla's inclusion on the S&P since it met the appropriate criteria—it's headquartered in the US, has a market cap well over the minimum $8.2 billion required, was highly liquid and had finally reached a point where the sum of its earnings for the trailing previous four quarters was positive. Some are saying that's why the shares enjoyed such a steep run-up ahead of the reshuffle.
Many consider the price of Tesla shares—even before the recent up-surge—to bear little resemblance to its underlying fundamentals. Nonetheless, we were bullish on Tesla in mid-August (before the split), and we're bullish on it once again.
Technicals show why we think this could be a good point of rebound for the stock.

Tesla's been trading within a rising channel since its March bottom, when it entered this year’s first bear market, after plunging nearly 62% from its Feb. 19 peak record to its Mar. 18 bottom. That's almost double the current slide on a percentage basis.
In August, we forecast the stock would reach new highs after completing a bullish pennant, which indeed occurred. Afterward, it broke out of the rising channel, suggesting a steeper incline.
The current slump brought it back into the channel. However, it has found support by an even sharper uptrend line June 29, potentially the bottom of a new, even steeper rising channel, just like the upside breakout signaled.
While the 100 DMA points toward the bottom of the original rising channel, the faster, 50 DMA suggests the recent, more precipitous (dotted) uptrend line may be the new demand-boundary. Meanwhile, the stock is back up above $350, in the pre-market, at time of writing.
Even if this young trend-line won’t stand up to the pressure, the price is still expected to bounce off the bottom of the original rising channel. While it may appear counterintuitive, despite the stock’s being within a bear market, based on the arbitrary, accepted 20% move, it is still within an uptrend, as per the direction of its peaks and troughs—demonstrating overall rising demand.
Trading Strategies
Conservative traders would wait with a long position for the price to return to the bottom of the original channel, after rebounding, with evidence that demand still outweighs supply at these levels, with at least a single, long green candle.
Moderate traders may buy at the bottom of the new channel, after support was confirmed with accumulation.
Aggressive traders may enter a long position at will, provided they understand, accept and can withstand the risk, without it affecting their portfolio to the extent that they couldn’t recover. Money management is key. Here’s an example:
Trade Sample
- Entry: $350
- Stop-Loss: $325 – below yesterday’s low
- Risk: $25
- Target: $500
- Reward: $150
- Risk:Reward Ratio: 1:6
Author's Note: This above is just a sample, not the actual analysis. For that, you must read and understand the full post. If you didn’t, do NOT make the trade, and if you do, it’s still a gamble.
This sample is not necessarily the best way to approach the trade. It depends on your timing, budget and risk aversion. Feel free to fine tune the parameters to optimize the trade. If you don’t know how to do that, do NOT make the trade, and if you do, it’s still a risk.
For example, raise the target to $550 to increase your risk-reward ratio to 1:10, but the price may not get there when you expect, or at all, for that matter. If you do increase the target, employ a trailing stop to capture gains. Good trading!
