-
Bitcoin’s rebound faces resistance at $59,000 but may rally to $65,000 if it breaks above that level.
-
Key support at $55,800 is crucial; a drop could lead to further declines.
-
Watch for volatility influenced by macroeconomic data amid rate cut speculation.
- For less than $9 a month, InvestingPro's Fair Value tool helps you find which stocks to hold and which to dump at the click of a button.
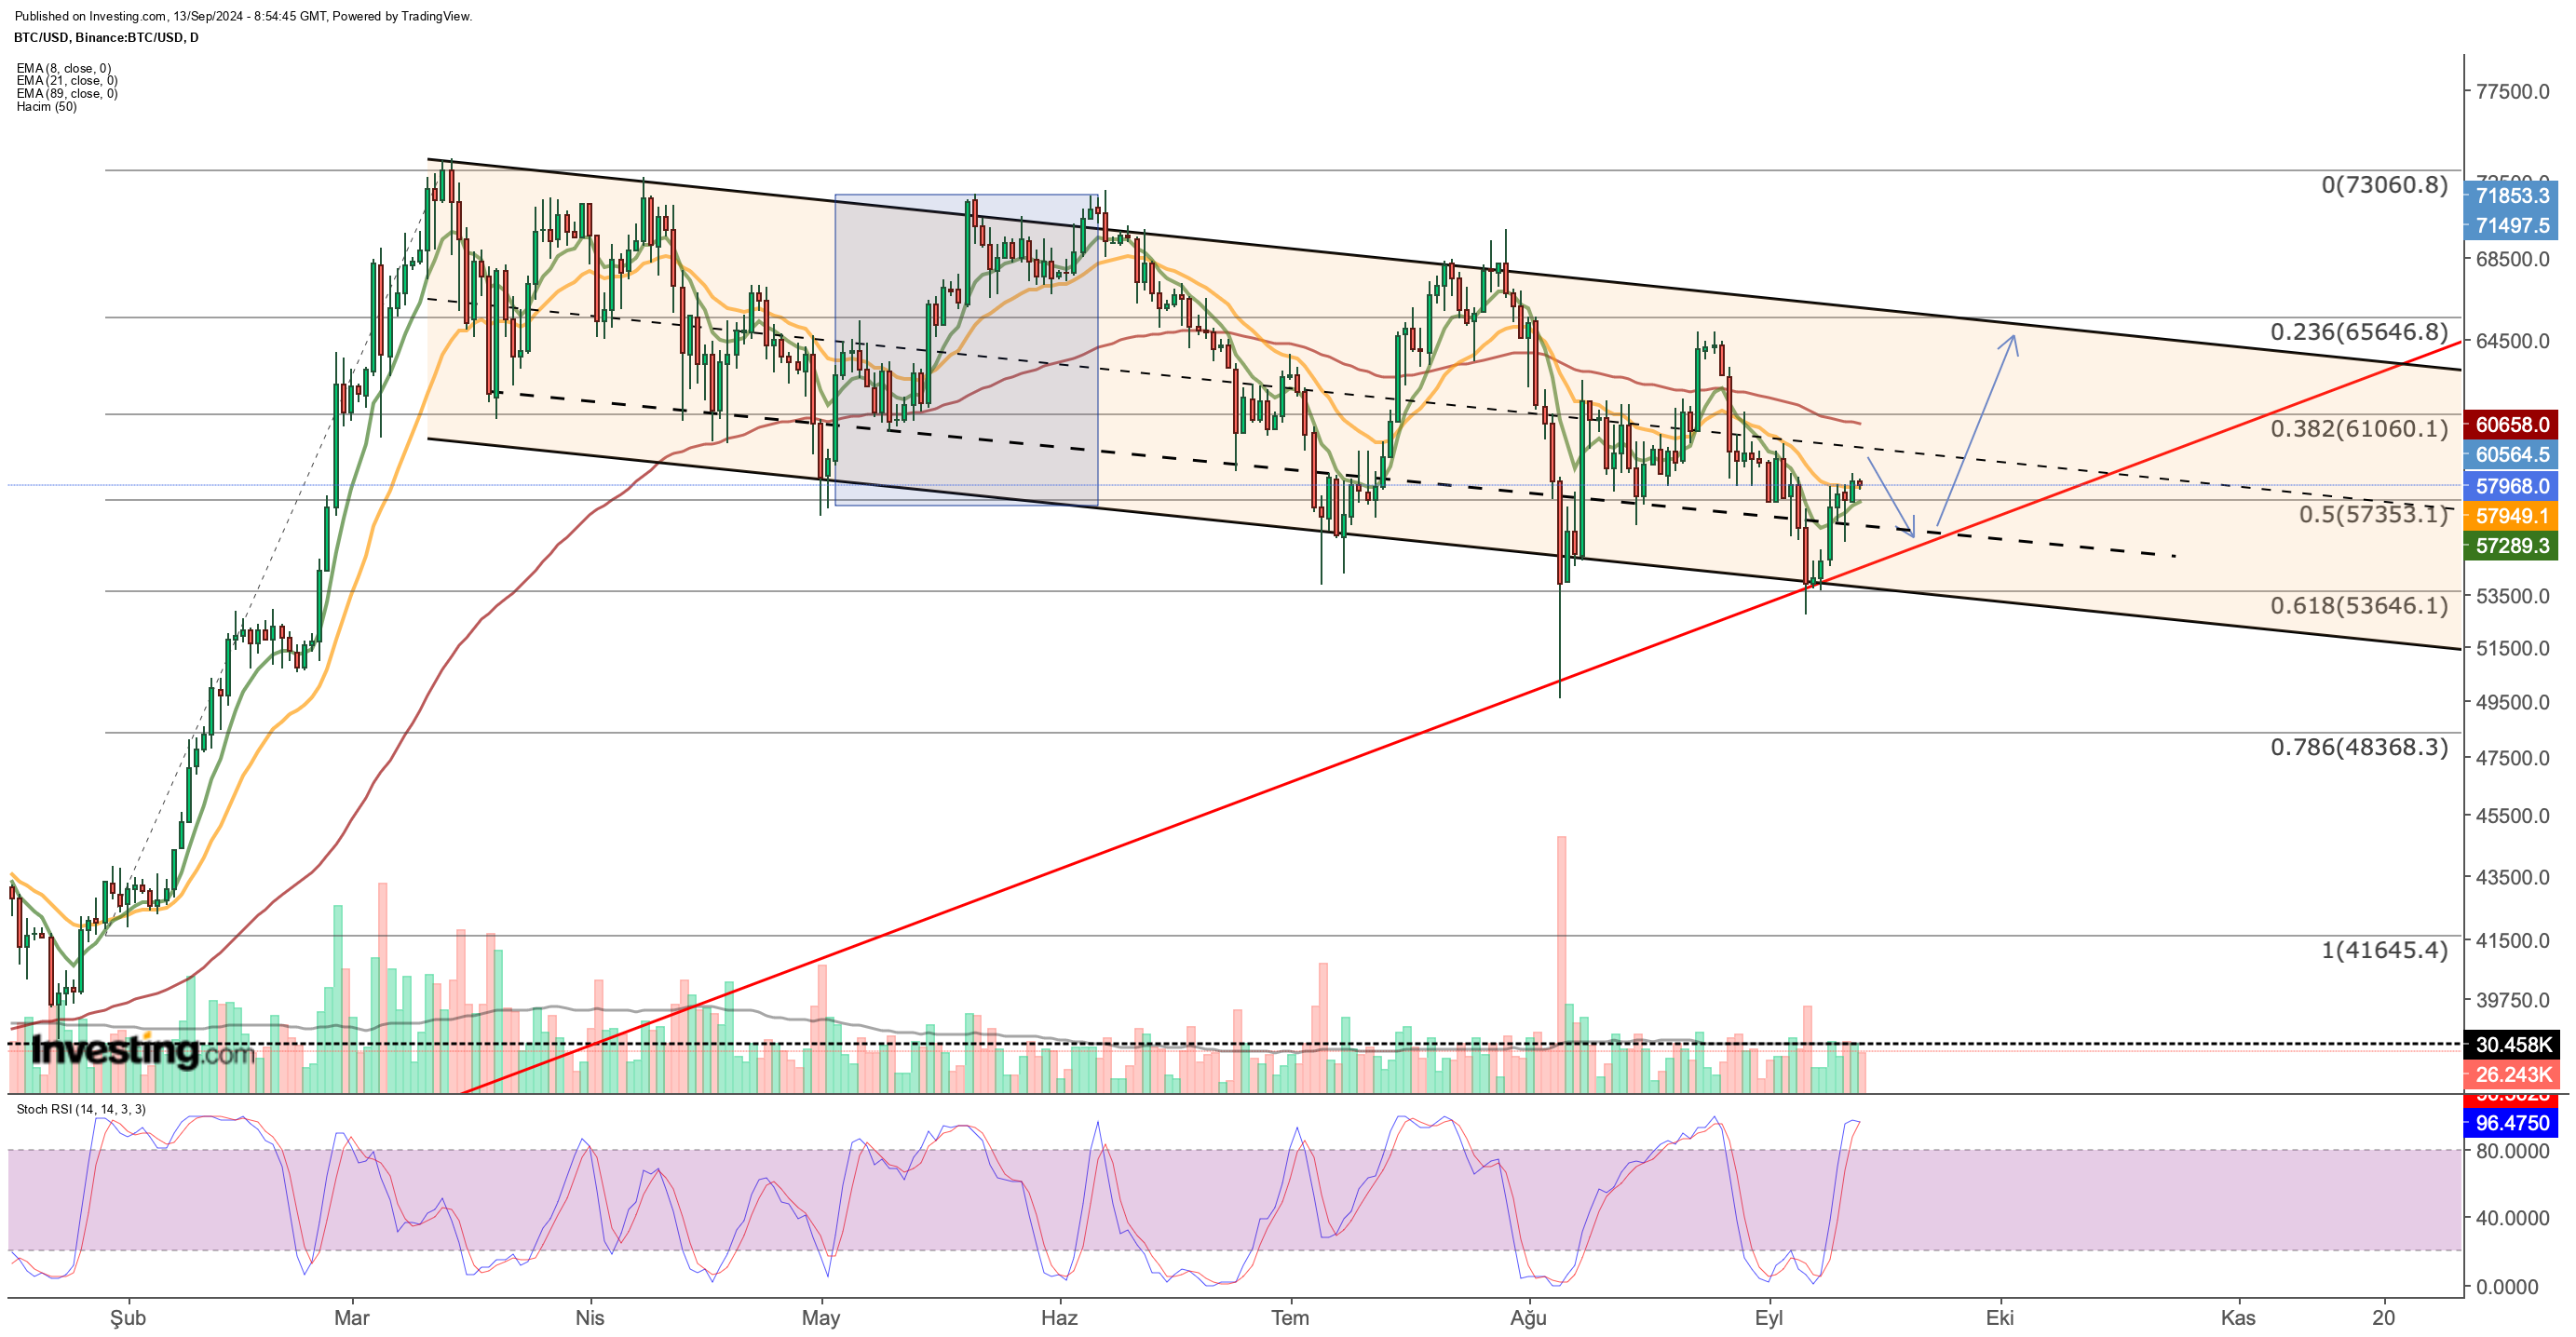
Bitcoin's recent downtrend seems to be slowing as demand picks up this week. The cryptocurrency has tested support at the lower boundary of its falling channel for the fourth time since March.
While the channel's lower limit tightened over the past six months, as shown by the dashed lines on the chart, it has expanded in recent months due to recent price declines.
This week’s early rebound aligns with a rising trend line that began in September 2023. Although this trend line initially lost significance during Bitcoin's exponential growth earlier in the year, it has regained importance as a support level during the current correction.
We’ll continue to monitor this rising trend line as a key support in the coming days.
Possible Scenarios for Bitcoin
Bitcoin's positive momentum this week faces resistance near the $57,900 mark, where the 21-day EMA acts as a dynamic barrier.
The Stochastic RSI, now in overbought territory, suggests a potential slowdown in buying pressure. Weekend trading might see further tests of the $58,000 level. However, without a new buying surge, profit-taking could follow the recent gains.

Should profit-taking push Bitcoin below $58,000, the $55,800 level will become crucial. This price sits at the intersection of the lower band of the falling channel and the medium-term uptrend. A hold at this level could set the stage for a stronger upward move.
If Bitcoin breaks through the channel’s middle line at $59,000 with strong volume after any decline to $55,800, we could see a rally similar to May's, potentially reaching $65,000.
The current technical indicators and moving averages mirror the early May price action, suggesting a possible rise to $65,000. However, the $61,000 level might act as an intermediate resistance.
Given Bitcoin's volatility, significant reactions often occur at intermediate support and resistance levels, as seen with the reaction purchases from the $53,500-$54,500 range last week.
- Bearish Scenario
If Bitcoin fails to sustain momentum at $58,000 and loses support at $55,800, it may drop to the $53,000-$53,500 range, aligning with the channel's lower band and Fib 0.618 support. A break below this level would target $48,300, supported by Fib 0.786, with an intermediate support around $50,000.
Macroeconomic Developments Impacting Bitcoin
This week’s macroeconomic developments, including US CPI and PPI figures, unemployment claims, and the ECB's interest rate decision, largely met expectations, supporting a moderate rise in Bitcoin. However, the market focus shifted to the potential for a 25 bps Fed rate cut on September 18th due to persistent core inflation, which limited the recovery.
Retail sales data, scheduled for release the day before the Fed's decision, will be crucial. A figure aligning with the 0.2% expectation could bolster market optimism. Nonetheless, expectations are leaning towards a modest rate cut, already priced in by the market. Post-decision, investors will look for guidance on the Fed’s projections for the rest of the year, which may prompt a new phase of market adjustments based on Powell's statements.
***
Disclaimer: This article is for informational purposes only and does not constitute investment advice or a solicitation to buy assets. Investing involves risk, and any decisions should be made with caution and consideration of personal circumstances. We do not provide investment advisory services.
