- Bitcoin recently broke above its trading channel, surging to $44,000 and eventually finding support at $43,100 after a partial retracement.
- The 4-hour chart's Stochastic RSI suggests potentially oversold conditions, indicating a possible test of the $42,700 support line.
- Long-term outlook suggests that Bitcoin could move toward crucial support at $42,700 - $43,100, with eyes on the $48,000 target.
- Missed out on Black Friday? Secure your up to 60% discount on InvestingPro subscriptions with our extended Cyber Monday sale.
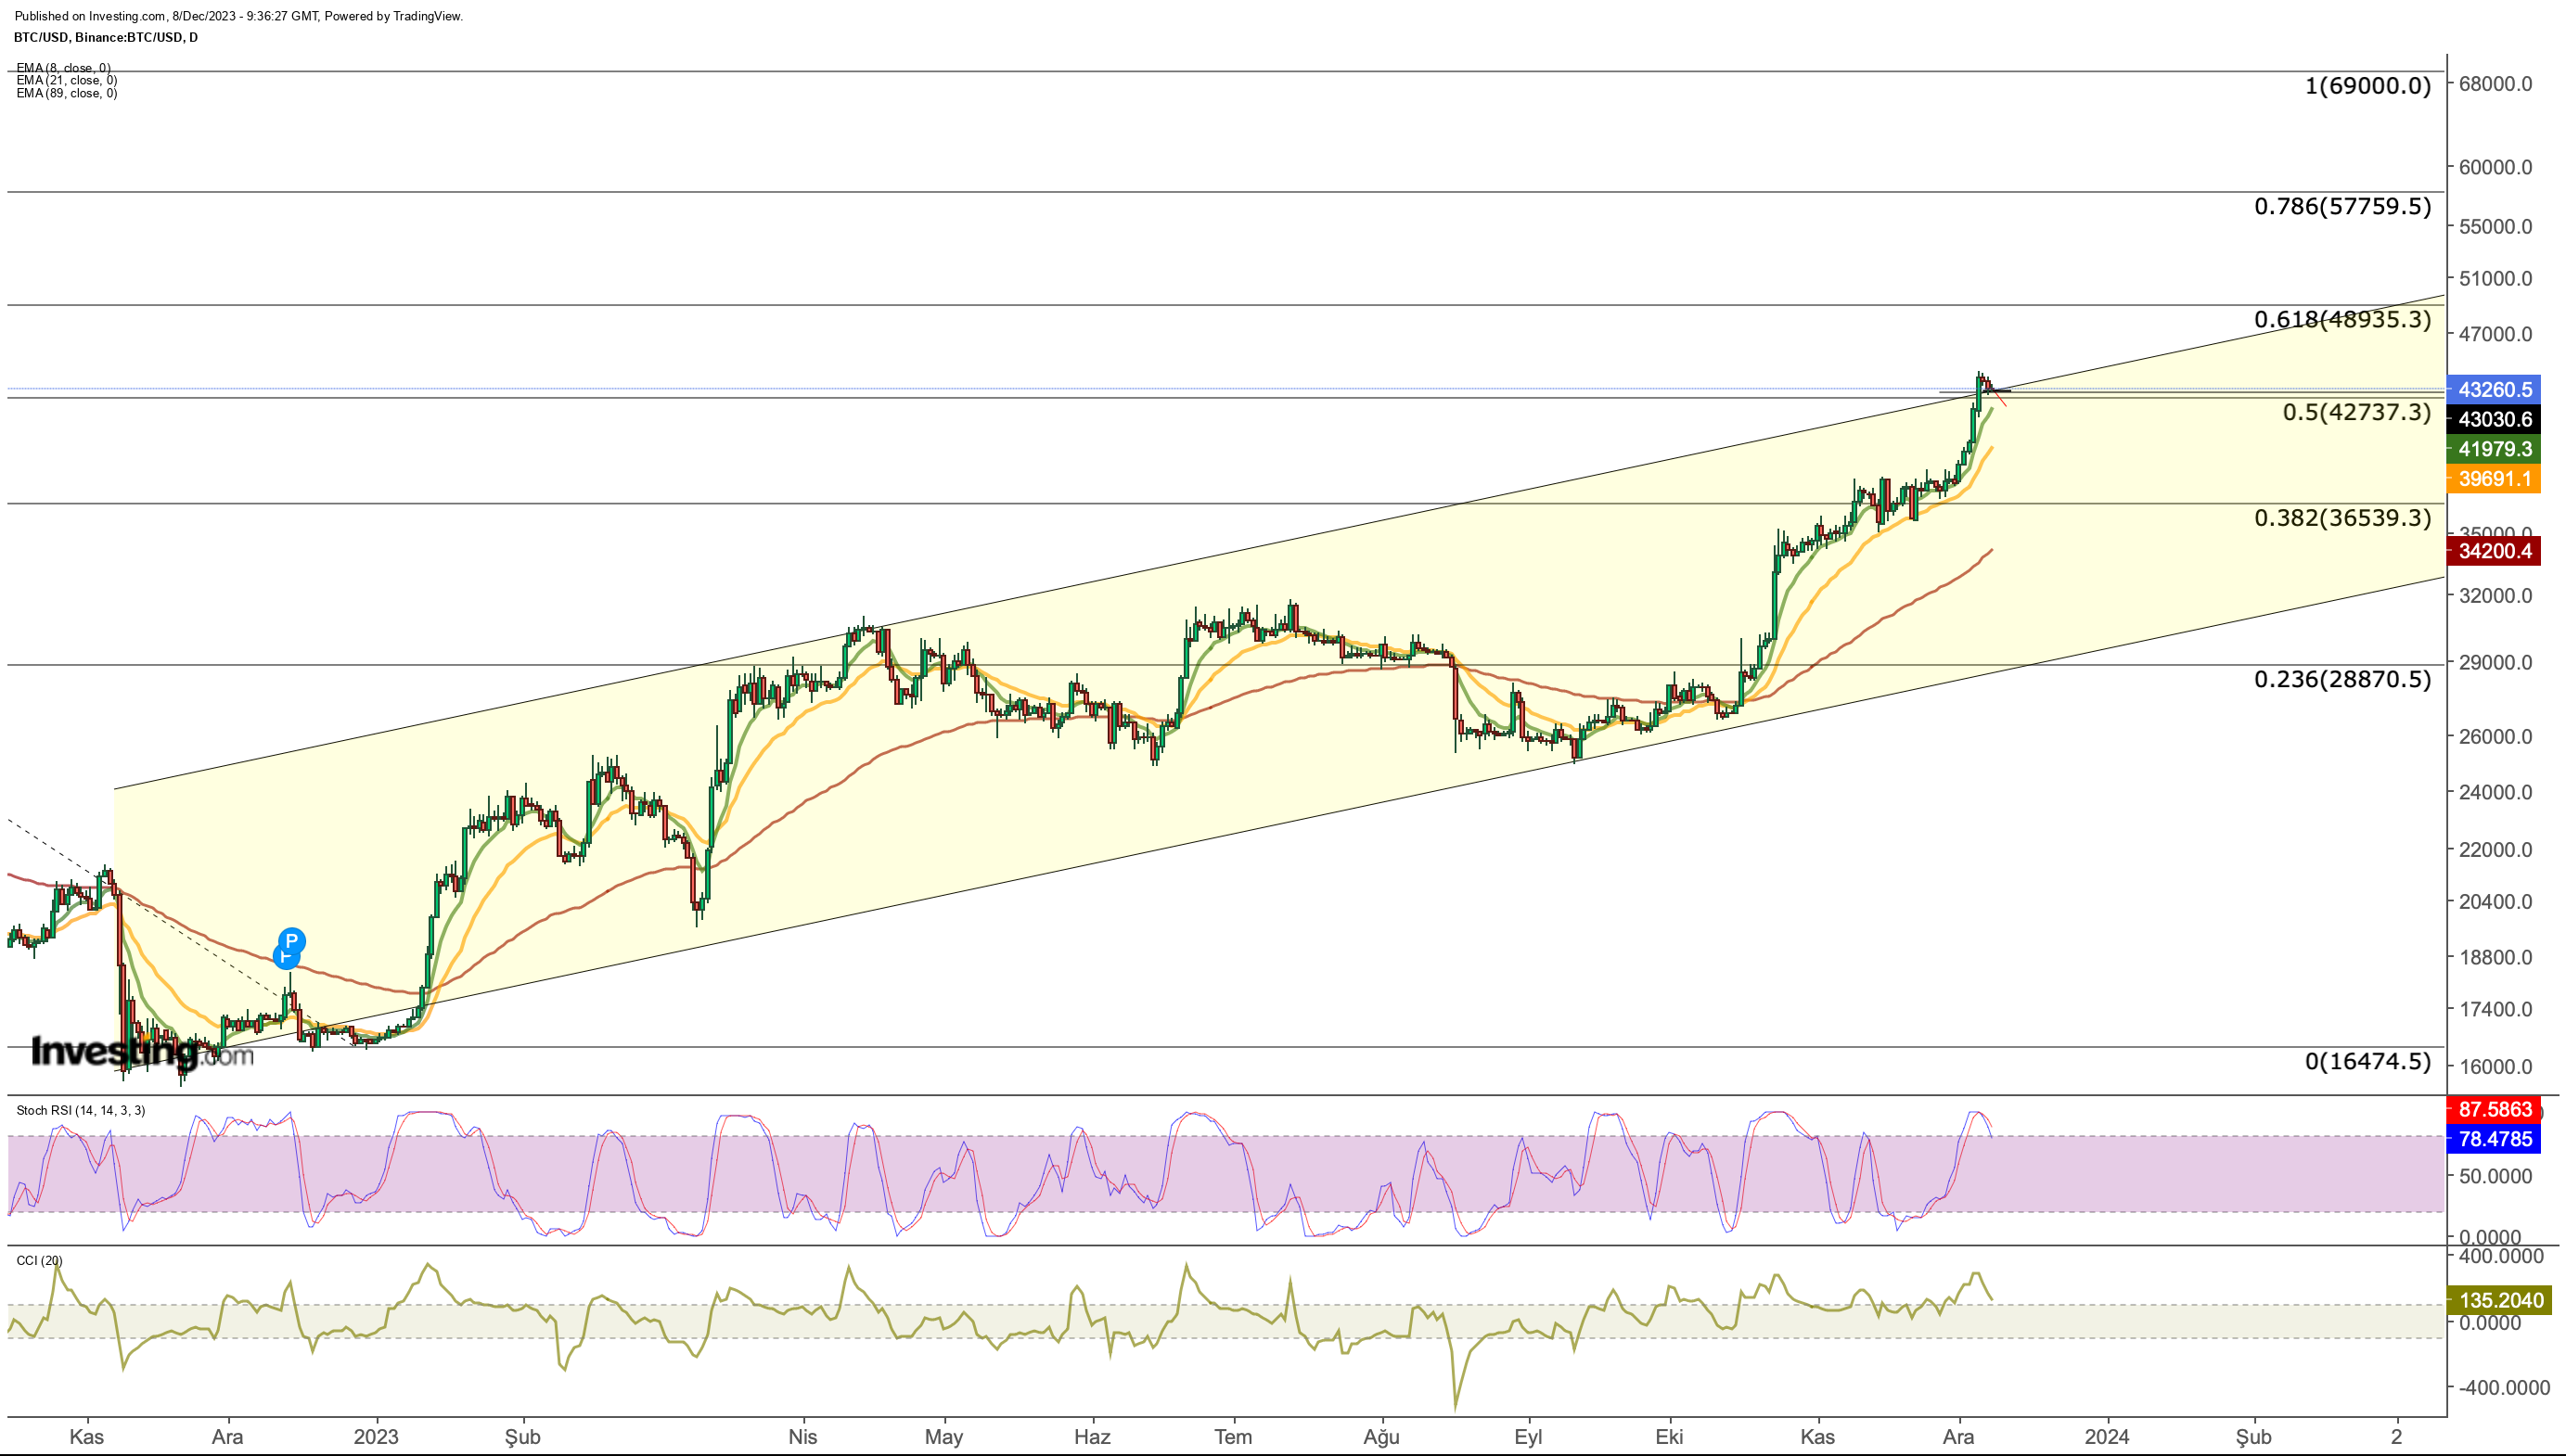
Entering the $40,000 range in its recent upward trajectory, Bitcoin surged to $44,000, surpassing the ascending channel established at the start of 2023.
Throughout November, the cryptocurrency grappled with a pivotal resistance level at $36,500, a challenge it overcame as December unfolded. With a positive market sentiment, Bitcoin gained momentum, reaching above $42,700, identified as the subsequent resistance.
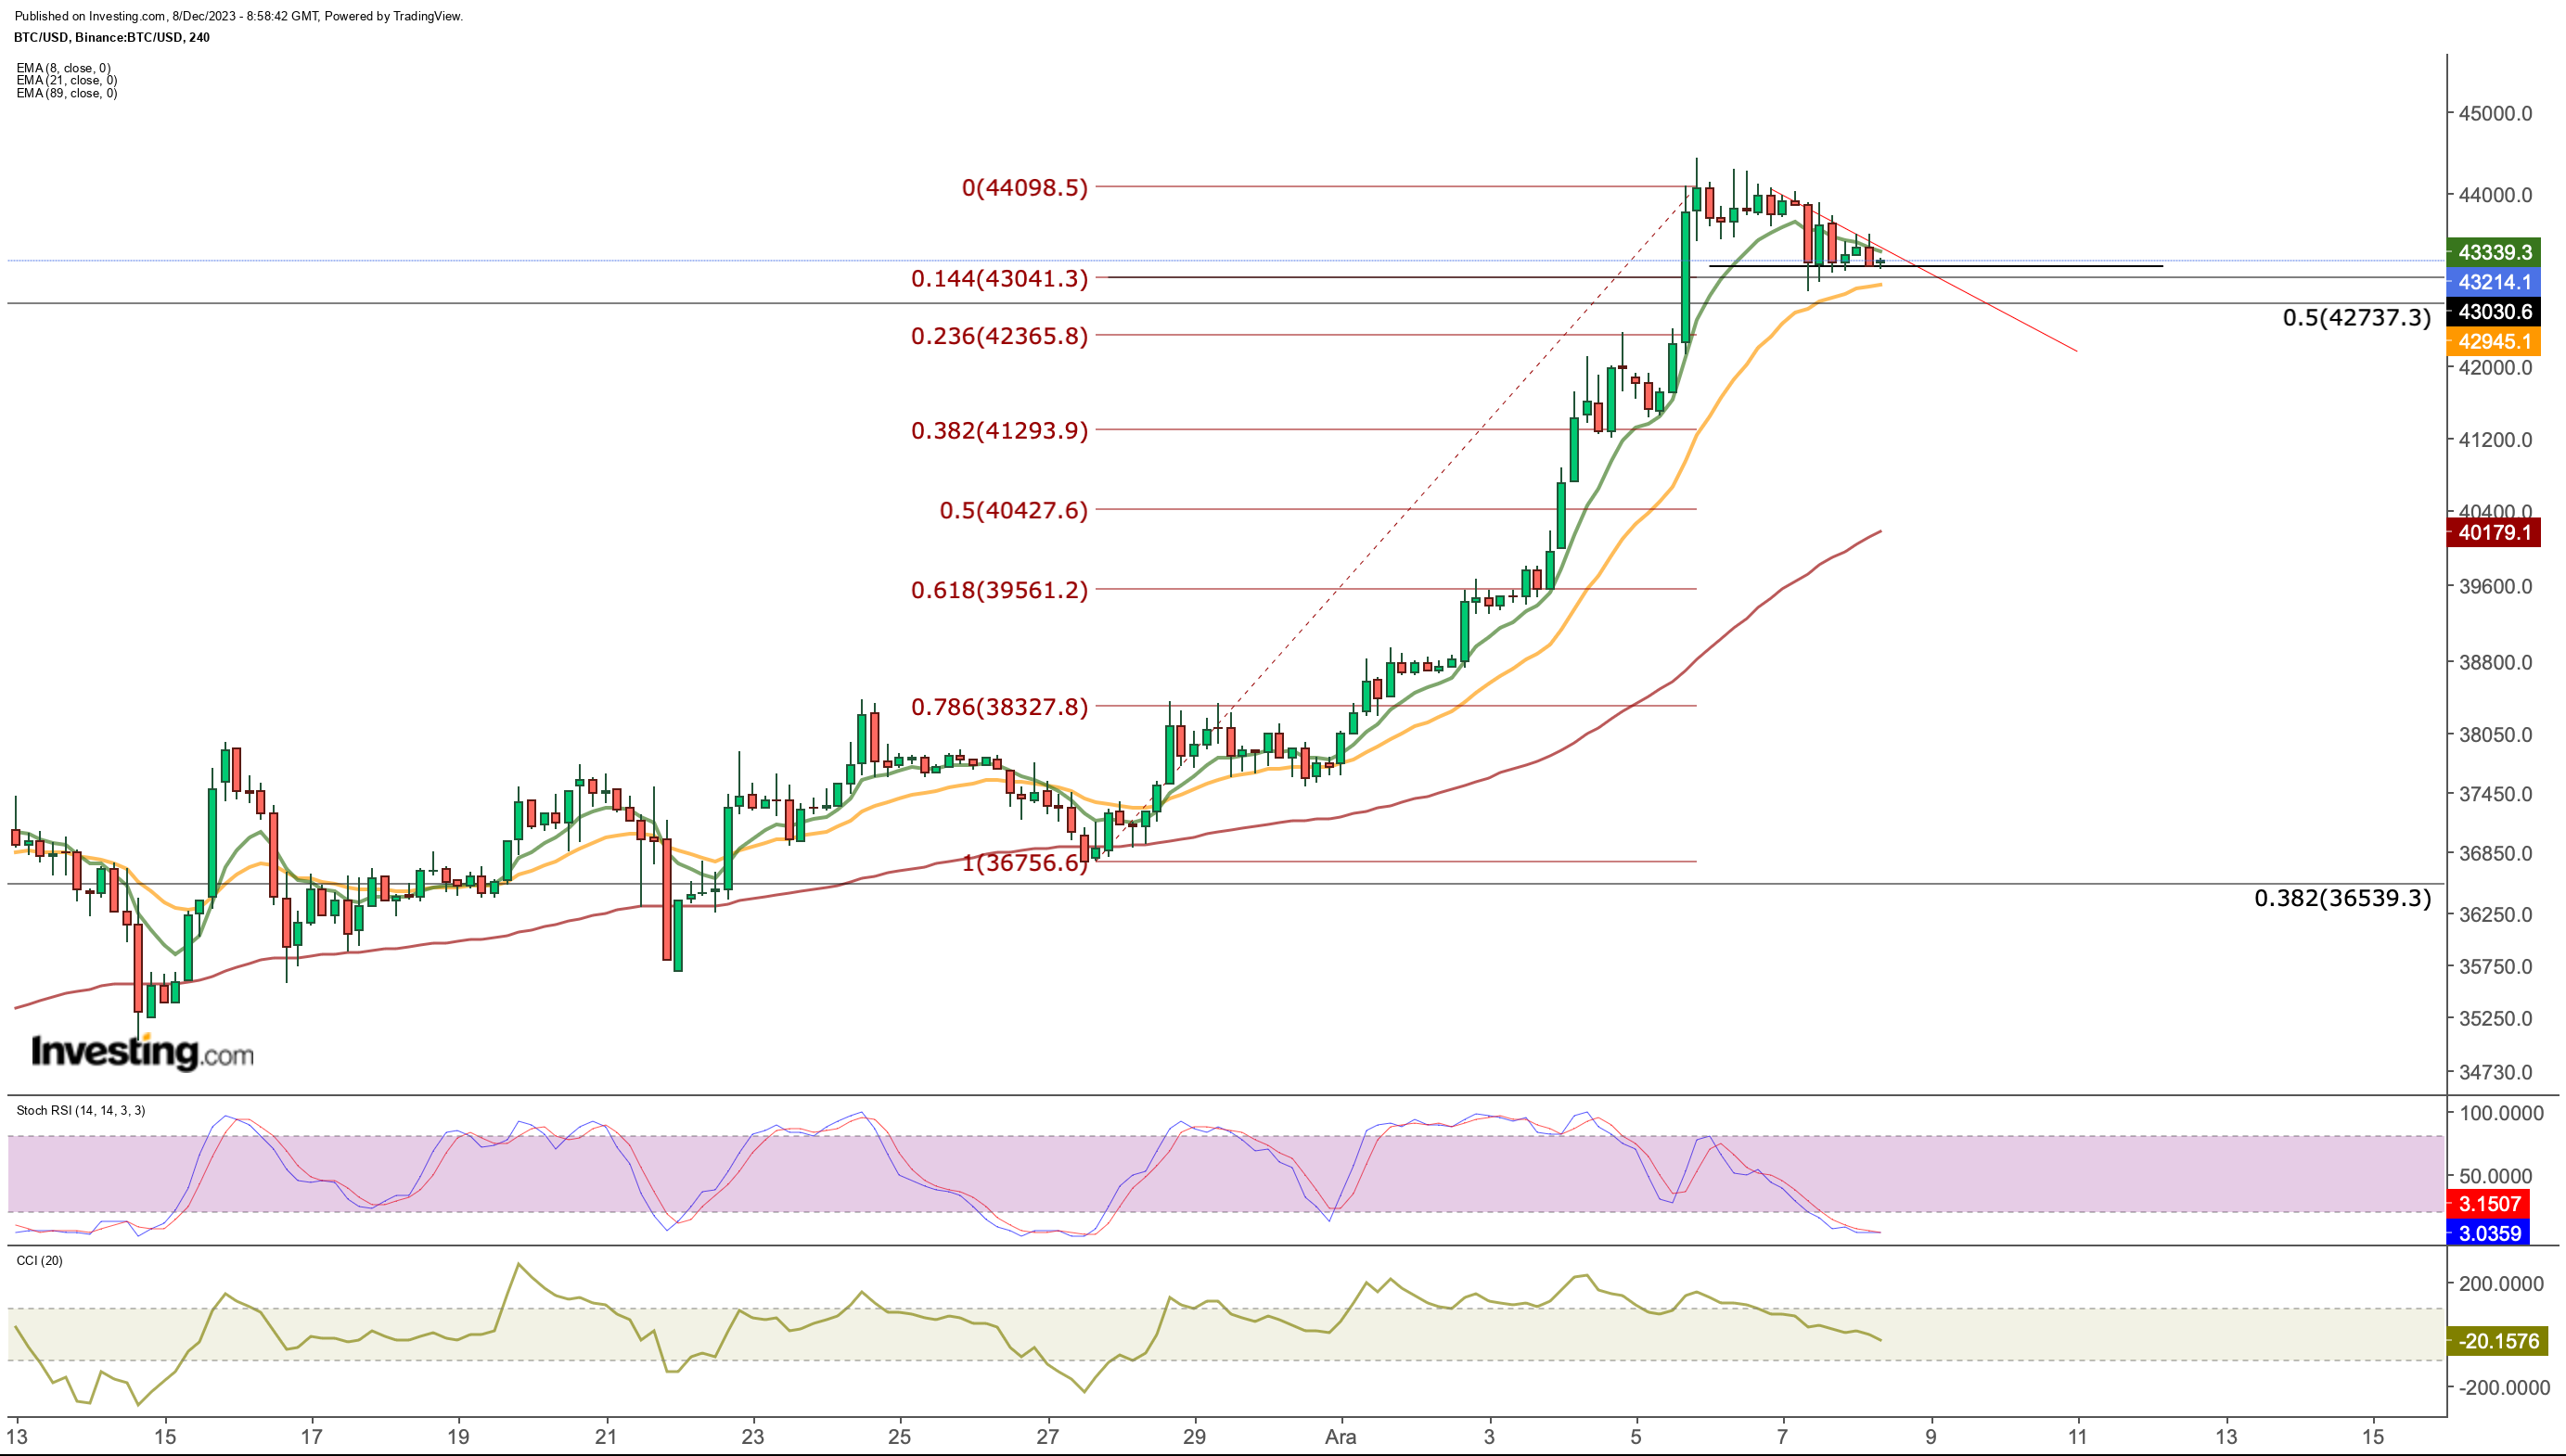
Despite achieving an annual peak of $44,400 midweek, the cryptocurrency experienced a partial retracement, finding support at $43,100. Consequently, $43,100 emerged as the nearest short-term support for BTC.
In the last 48 hours, a retracement led Bitcoin to dip below the 8-day EMA value, which had guided its ascent since December. Nevertheless, the cryptocurrency maintains bullish strength, hovering above its immediate short support at $42,950, with an untested, more substantial long-term support at $42,700.

A closer look at Bitcoin on the 4-hour chart shows that the Stochastic RSI indicator has moved down to the oversold zone in the partial pullback over the past two days. This outlook suggests that the price may test the support line extending to the $ 42,700 region.
The arrival of new purchases at this support line will technically trigger the trend to continue on its way. In this case, the Bitcoin price can be expected to close above the 8-EMA value, which is currently calculated at $ 43,300.
If we evaluate the recent upward momentum that started from the $ 36,000 region on November 27; According to Fibonacci levels, the $ 43,000 level corresponds to Fib 0.144, once again emphasizing the importance of the closely followed $ 42,700 - $ 43,100 support area.
Below this zone, 42,300 and then 41,300 dollar levels can be monitored as the 2nd and 3rd support prices in a possible correction movement. In the event of a retreat to these regions, a development that may increase selling pressure may cause BTC to test the $ 39,500 - $ 40,000 range.
As a result, for the continuation of the upward movement in the short-term outlook, it has become important for the week's closing to take place above the $ 42,700 - $ 43,100 support area.
When we evaluate Bitcoin in the long-term outlook, the current situation suggests that the next move is more likely toward support levels.
On the daily chart, the Stochastic RSI's downward reversal with a partial decline in the last 48 hours can be followed as a signal for a decline. If the indicator crosses below 80, it will show that there is an effect that may accelerate the correction momentum.
The support levels I mentioned above will be followed by daily closes and a clear daily candle formation can be expected above these values for a possible correction. In the general uptrend, the next target zone remains the $ 48,000 band.
On the other hand, the US Non-Farm Employment data to be released today may increase volatility in cryptocurrency markets. While employment in the US is expected to increase by 180k in November, data below this number may ensure the risk appetite stays intact.
Better-than-expected data may be perceived negatively, as it could contribute to increased inflationary pressures amid the sustained strength of the US economy. This could potentially trigger selling pressure in riskier markets, including cryptocurrencies.
***
With InvestingPro's stock screener, investors can filter through a vast universe of stocks based on specific criteria and parameters to identify cheap stocks with strong potential upside.
You can easily determine whether a company suits your risk profile by conducting a detailed fundamental analysis on InvestingPro according to your criteria. This way, you will get highly professional help in shaping your portfolio.
In addition, you can sign up for InvestingPro, one of the most comprehensive platforms in the market for portfolio management and fundamental analysis, much cheaper with the biggest discount of the year (up to 60%), by taking advantage of our extended Cyber Monday deal.
Disclaimer: This article is written for informational purposes only; it does not constitute a solicitation, offer, advice, or recommendation to invest as such it is not intended to incentivize the purchase of assets in any way. I would like to remind you that any type of asset, is evaluated from multiple points of view and is highly risky and therefore, any investment decision and the associated risk remains with the investor.

