Street Calls of the Week
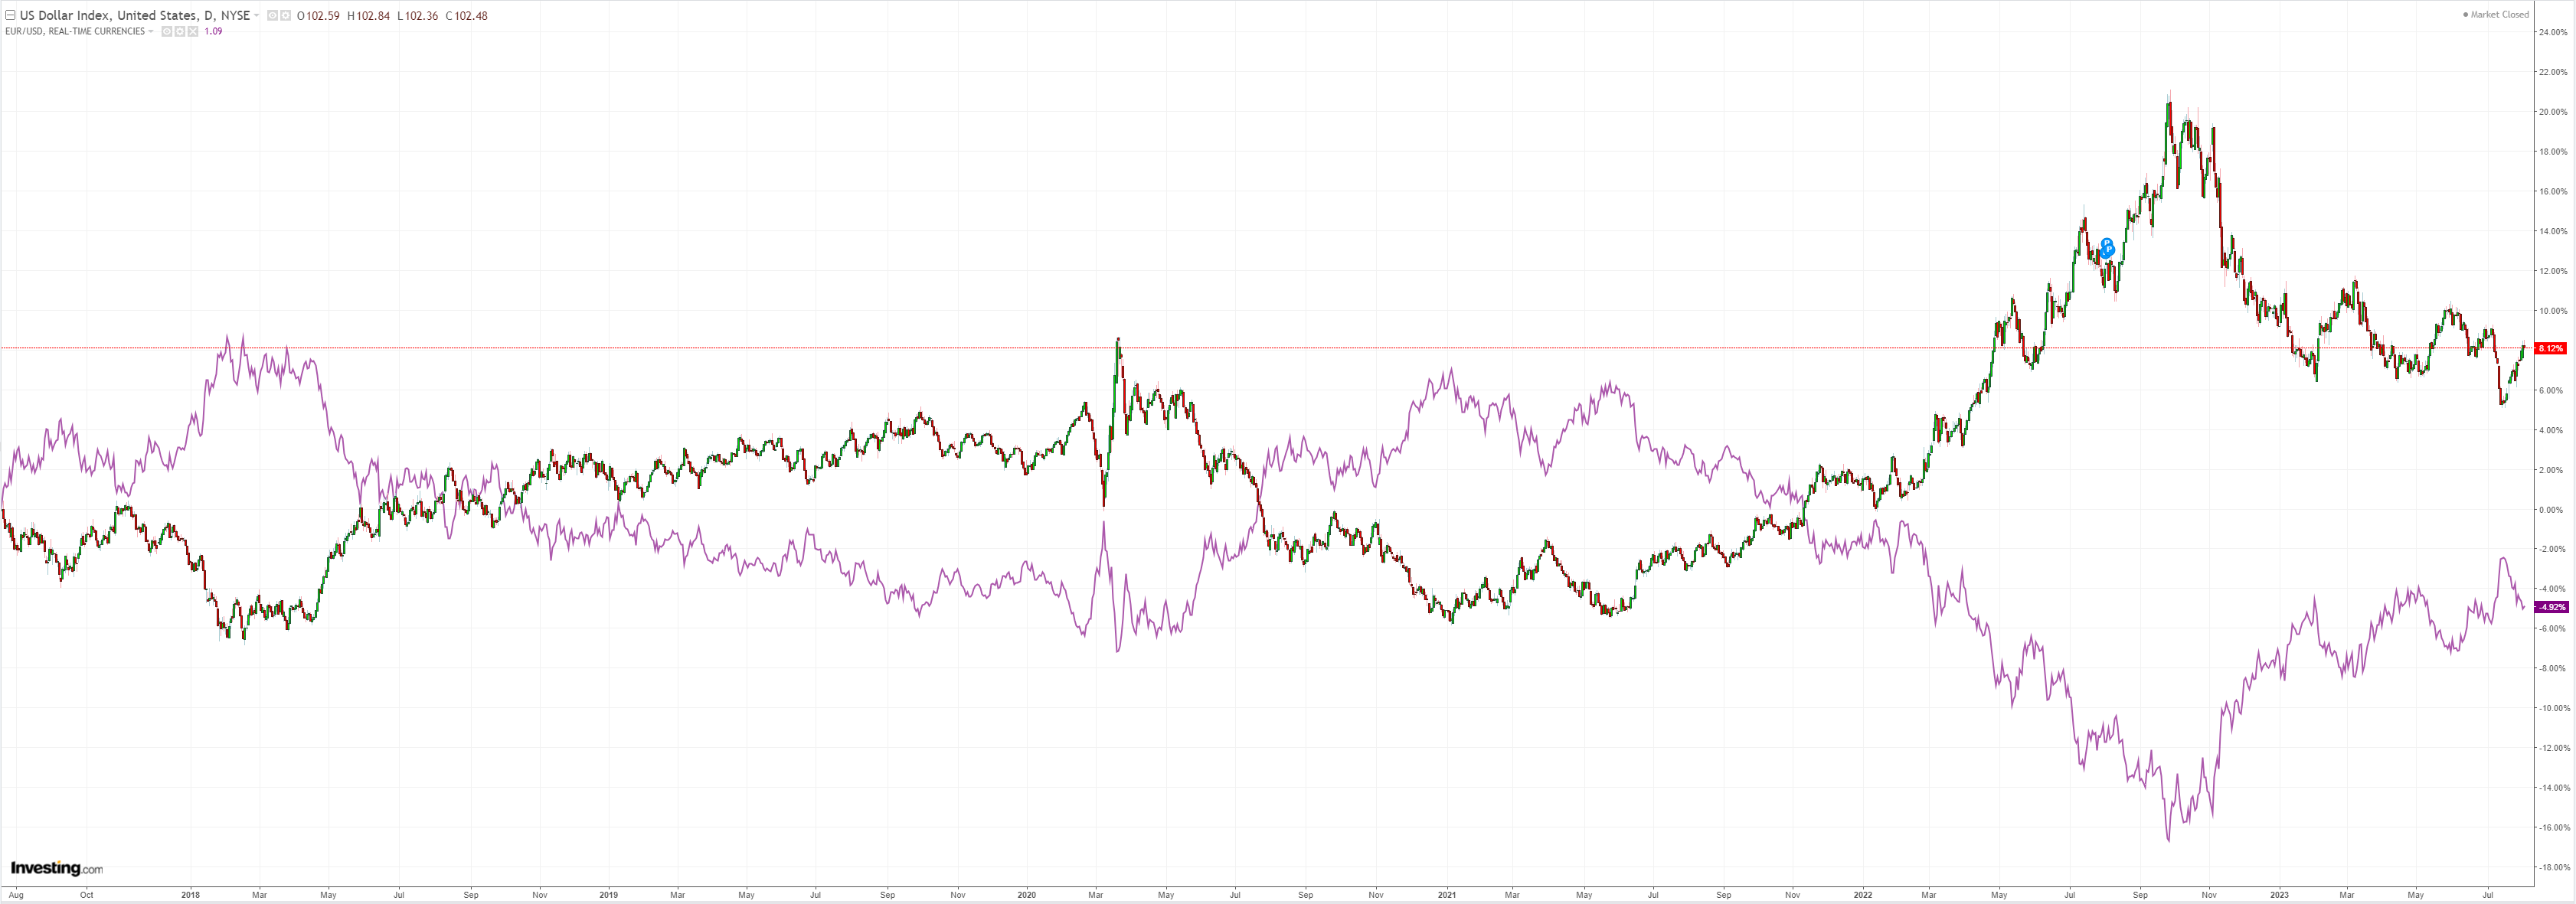
DXY took a breather:
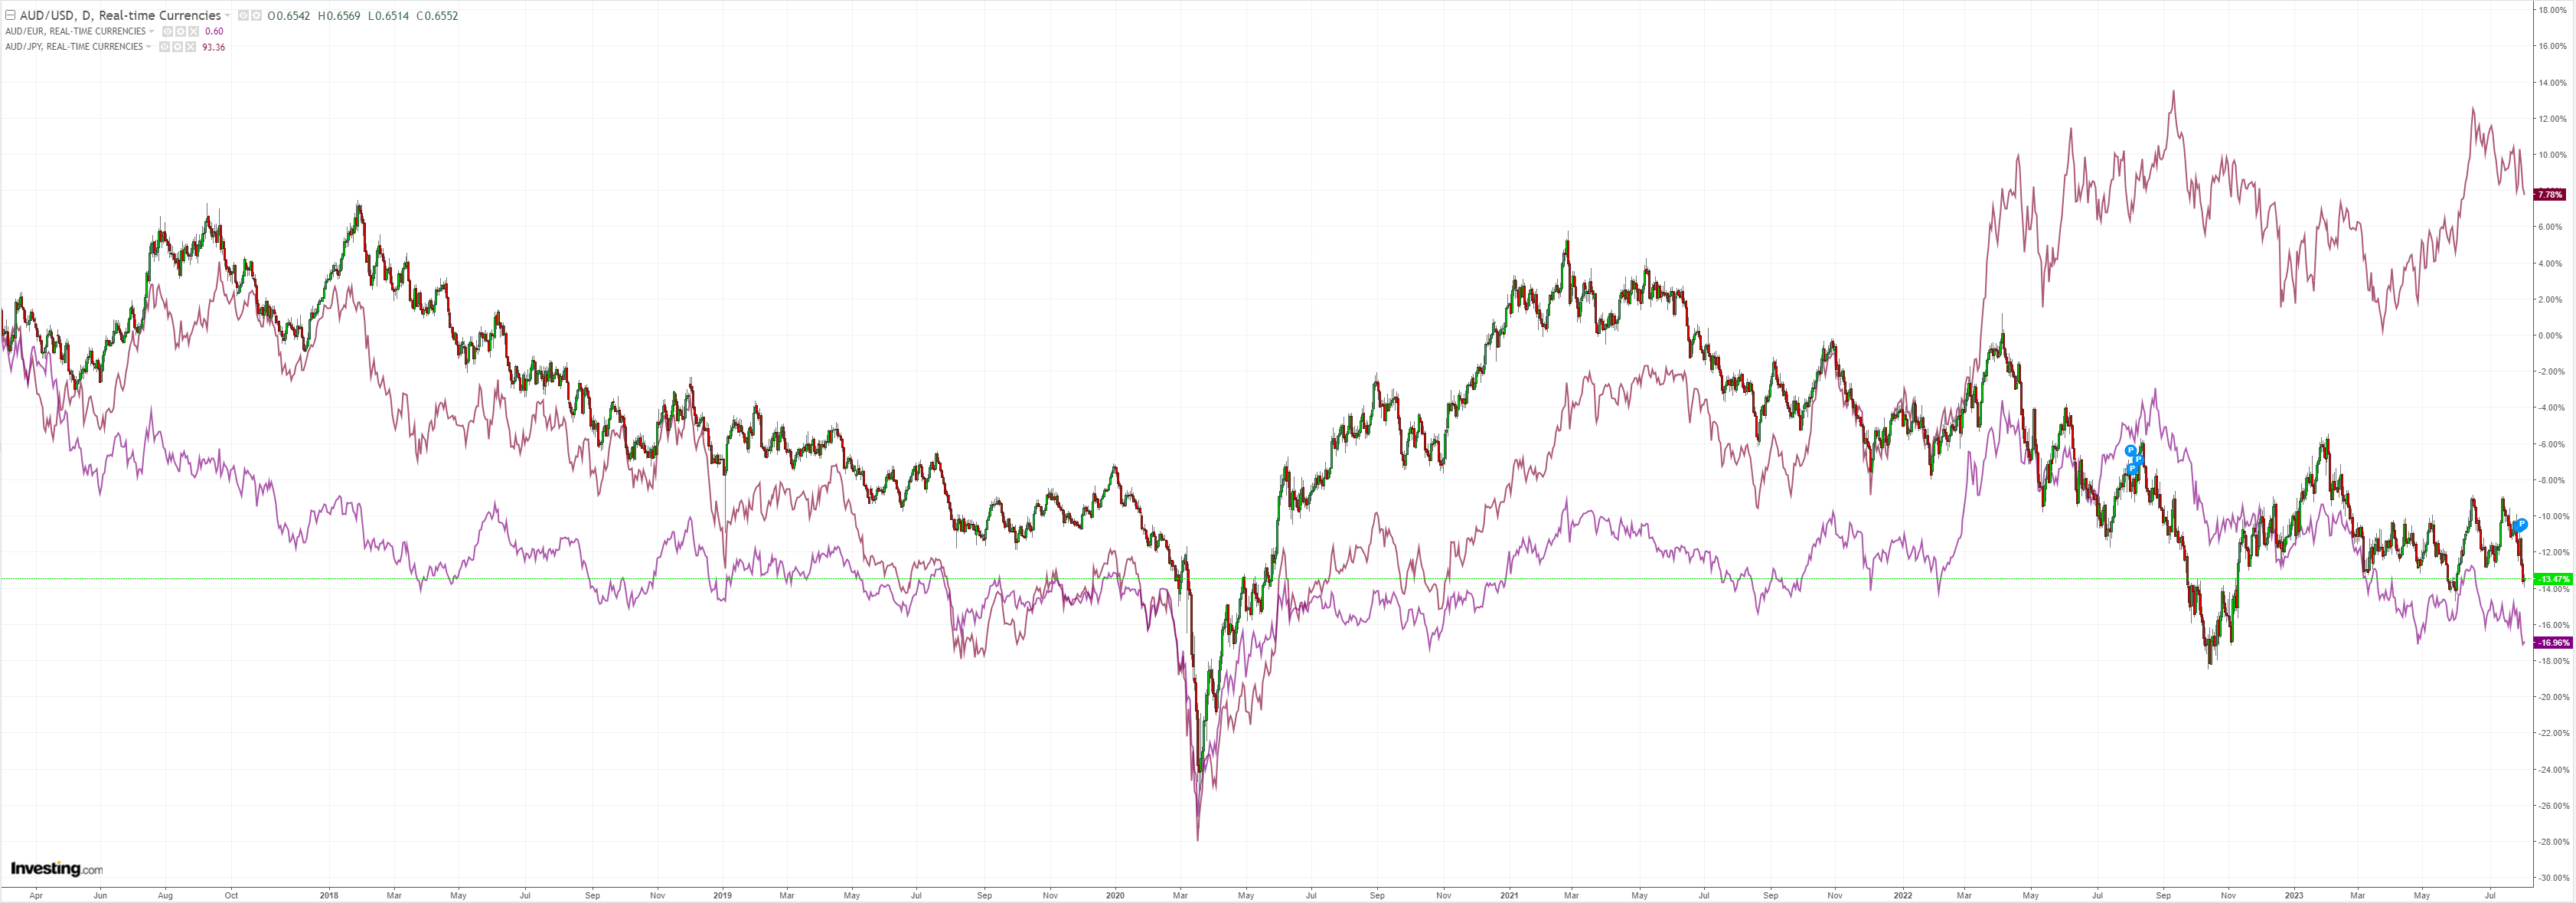
AUD is sitting in the 2022 critical support zone:
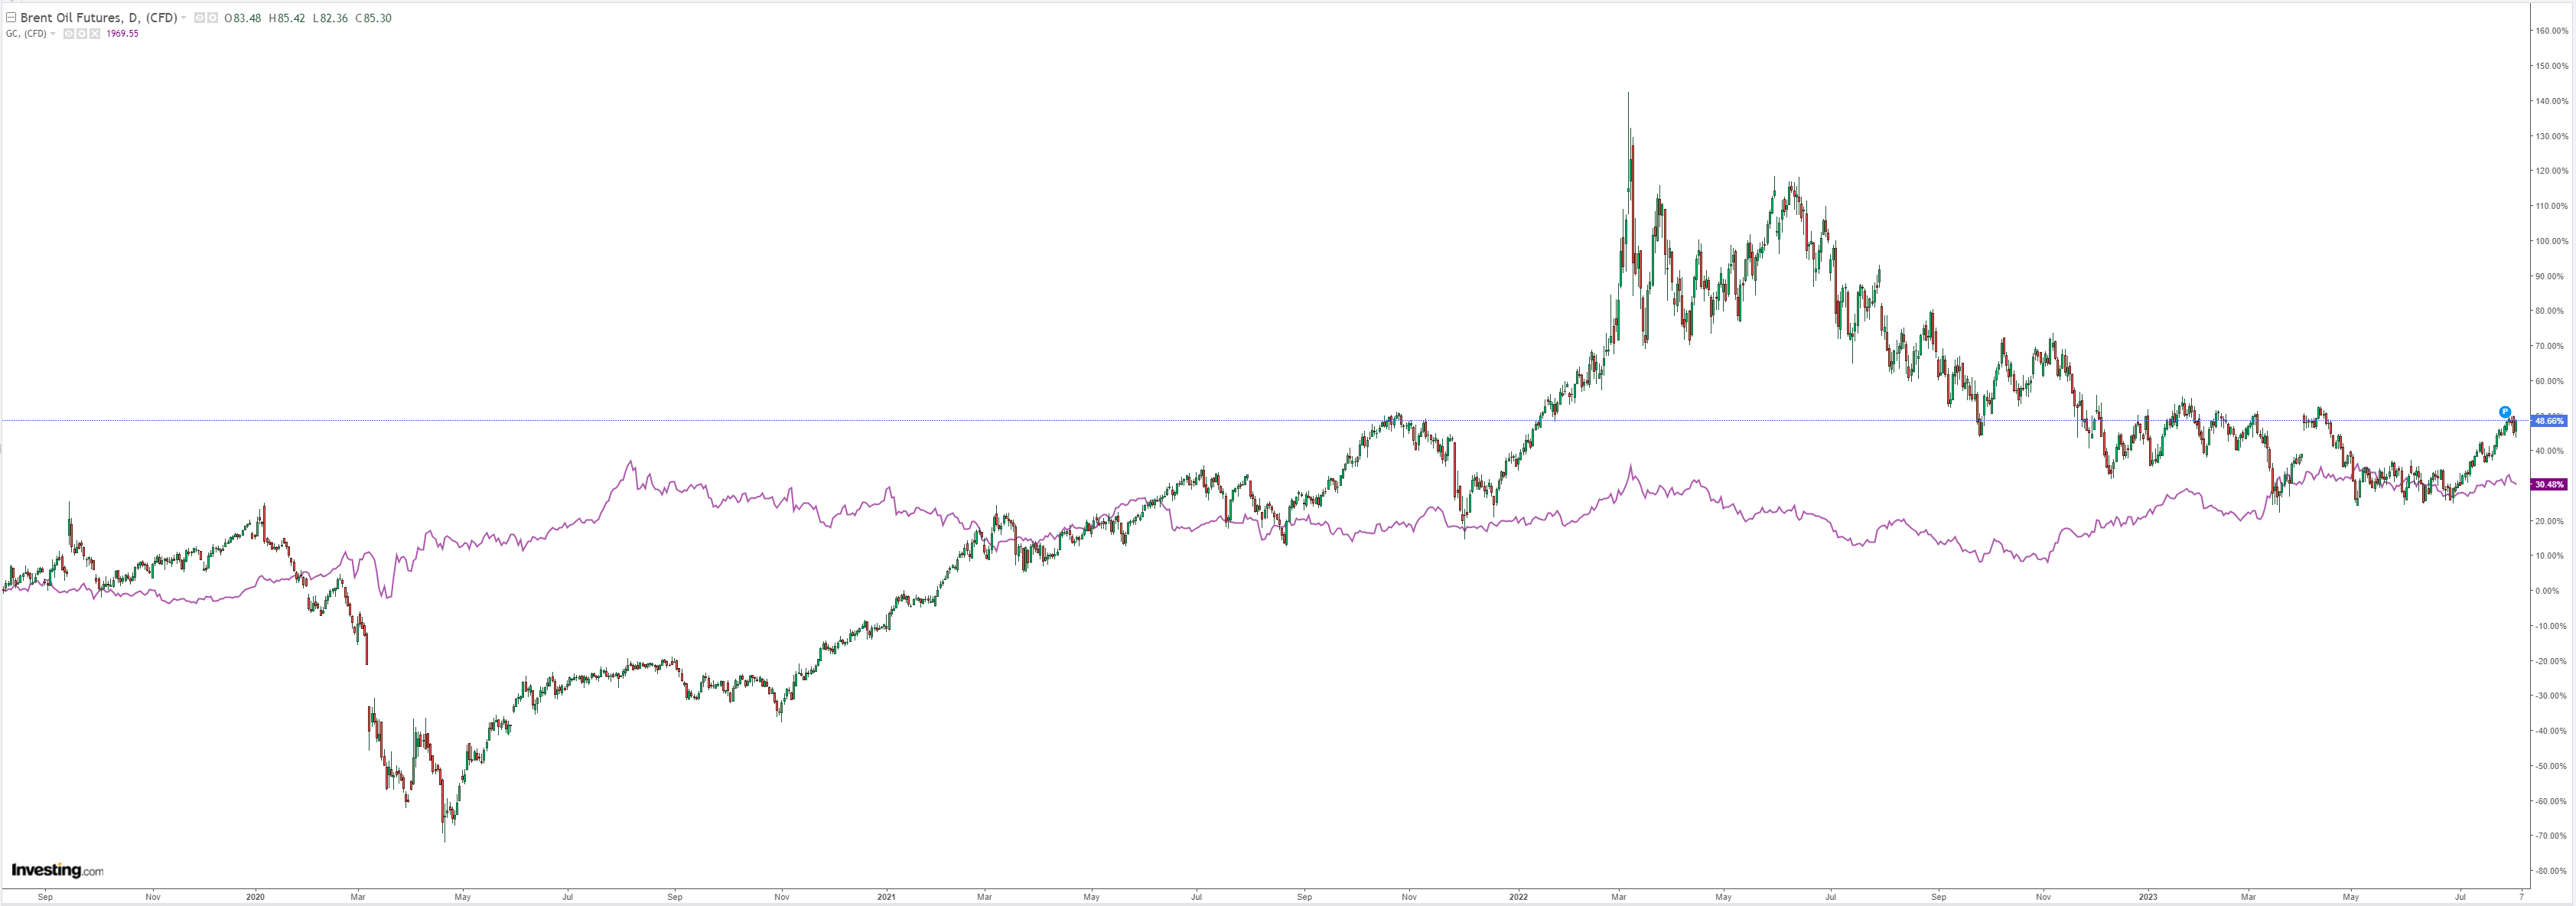
Dirt firmed:
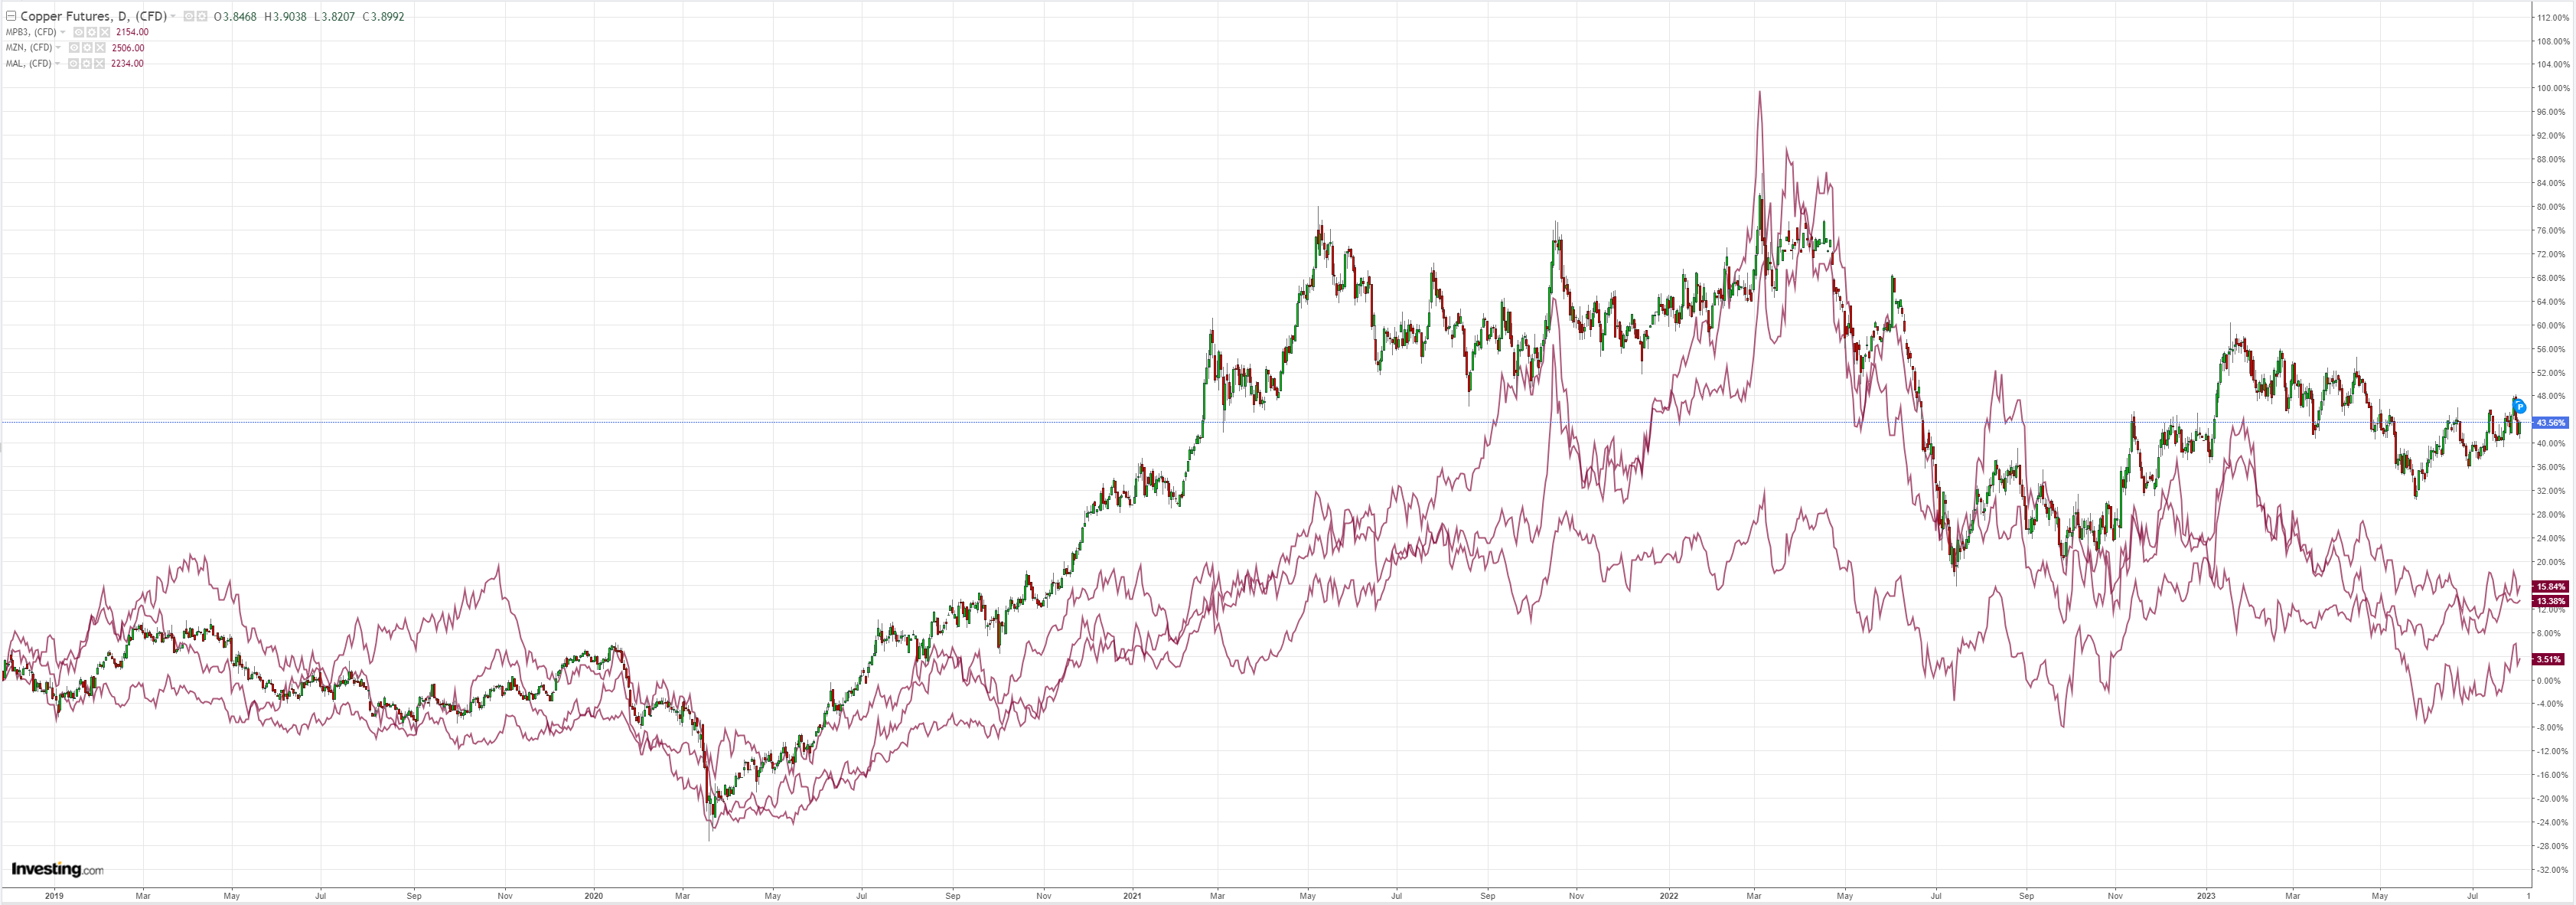
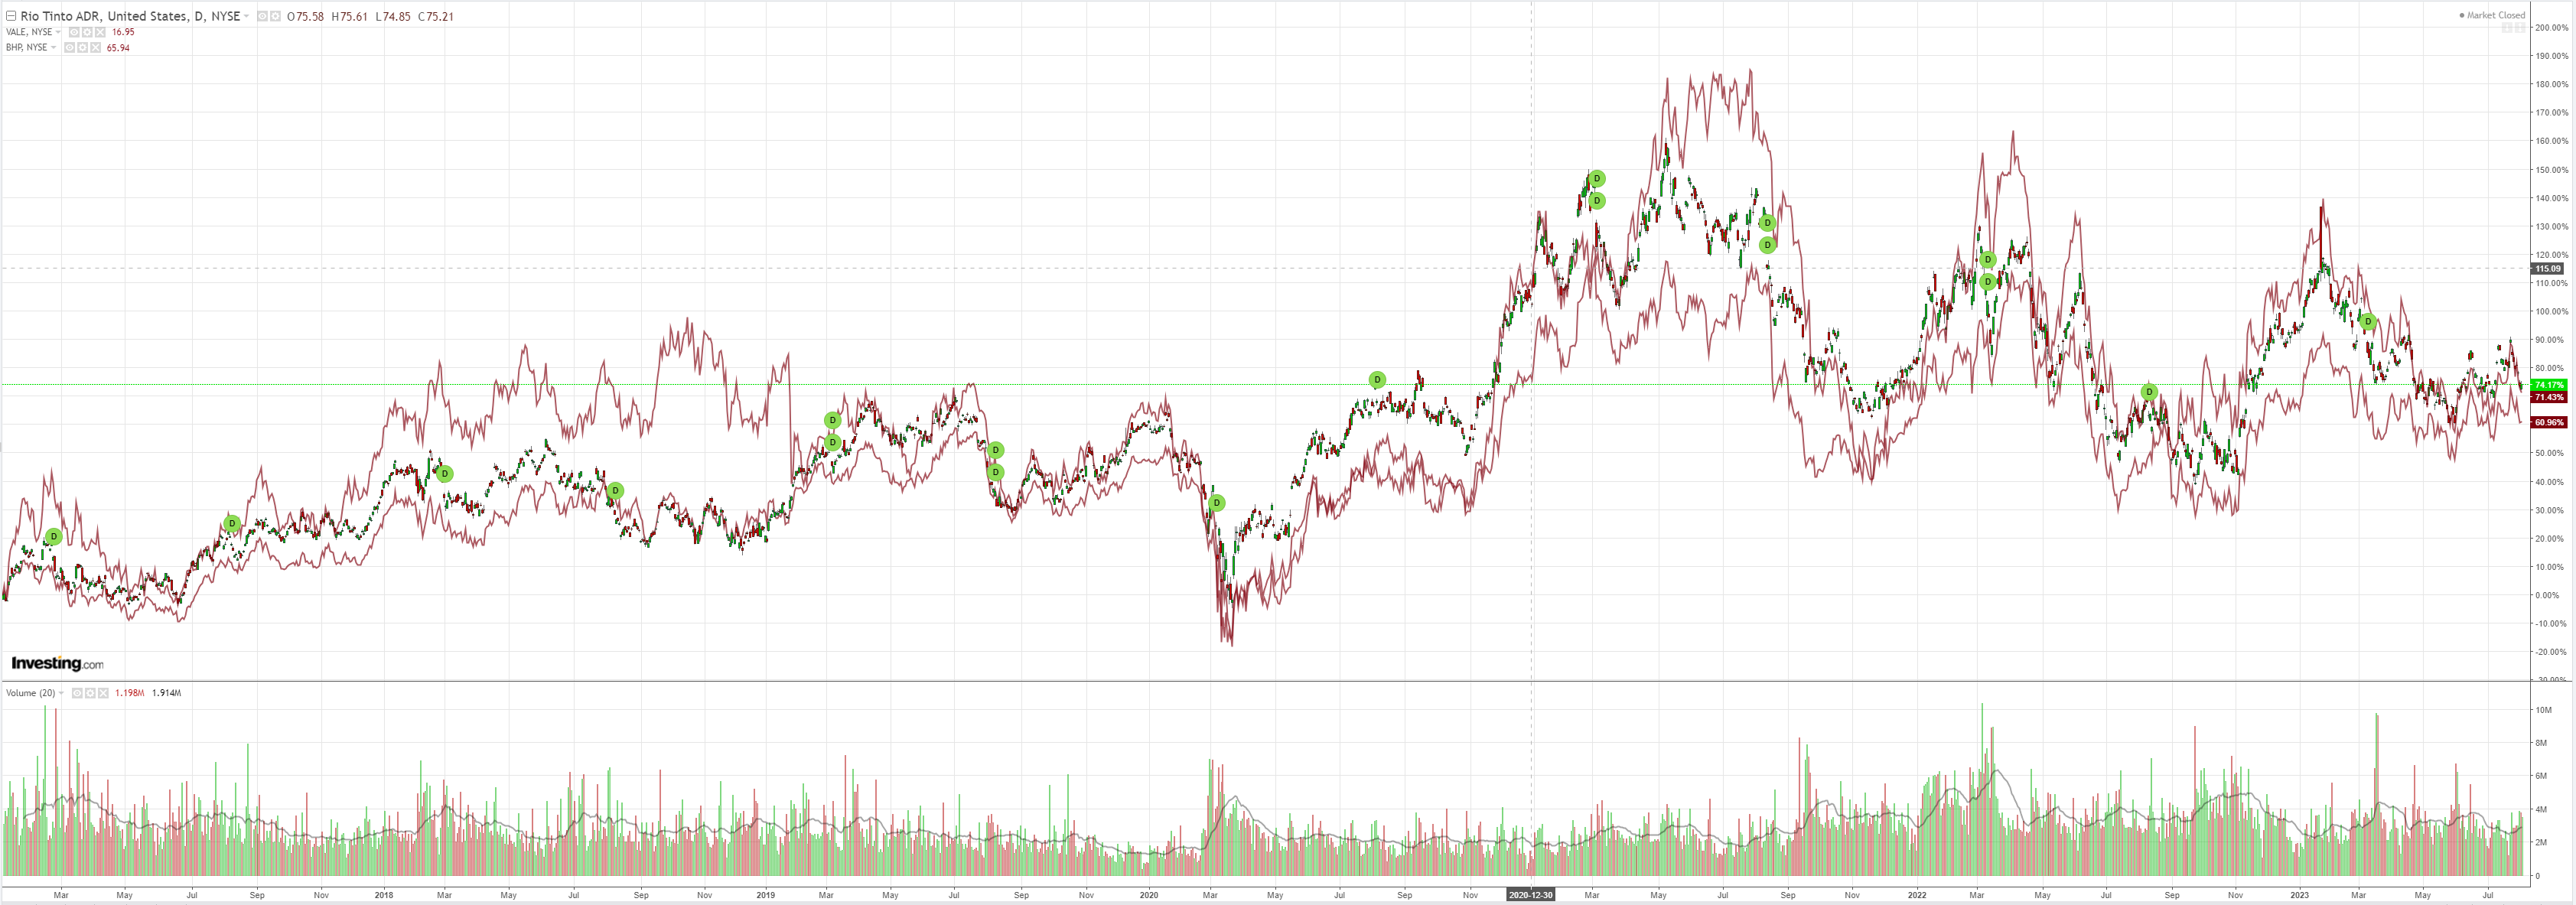
Miners (NYSE:RIO) didn’t:
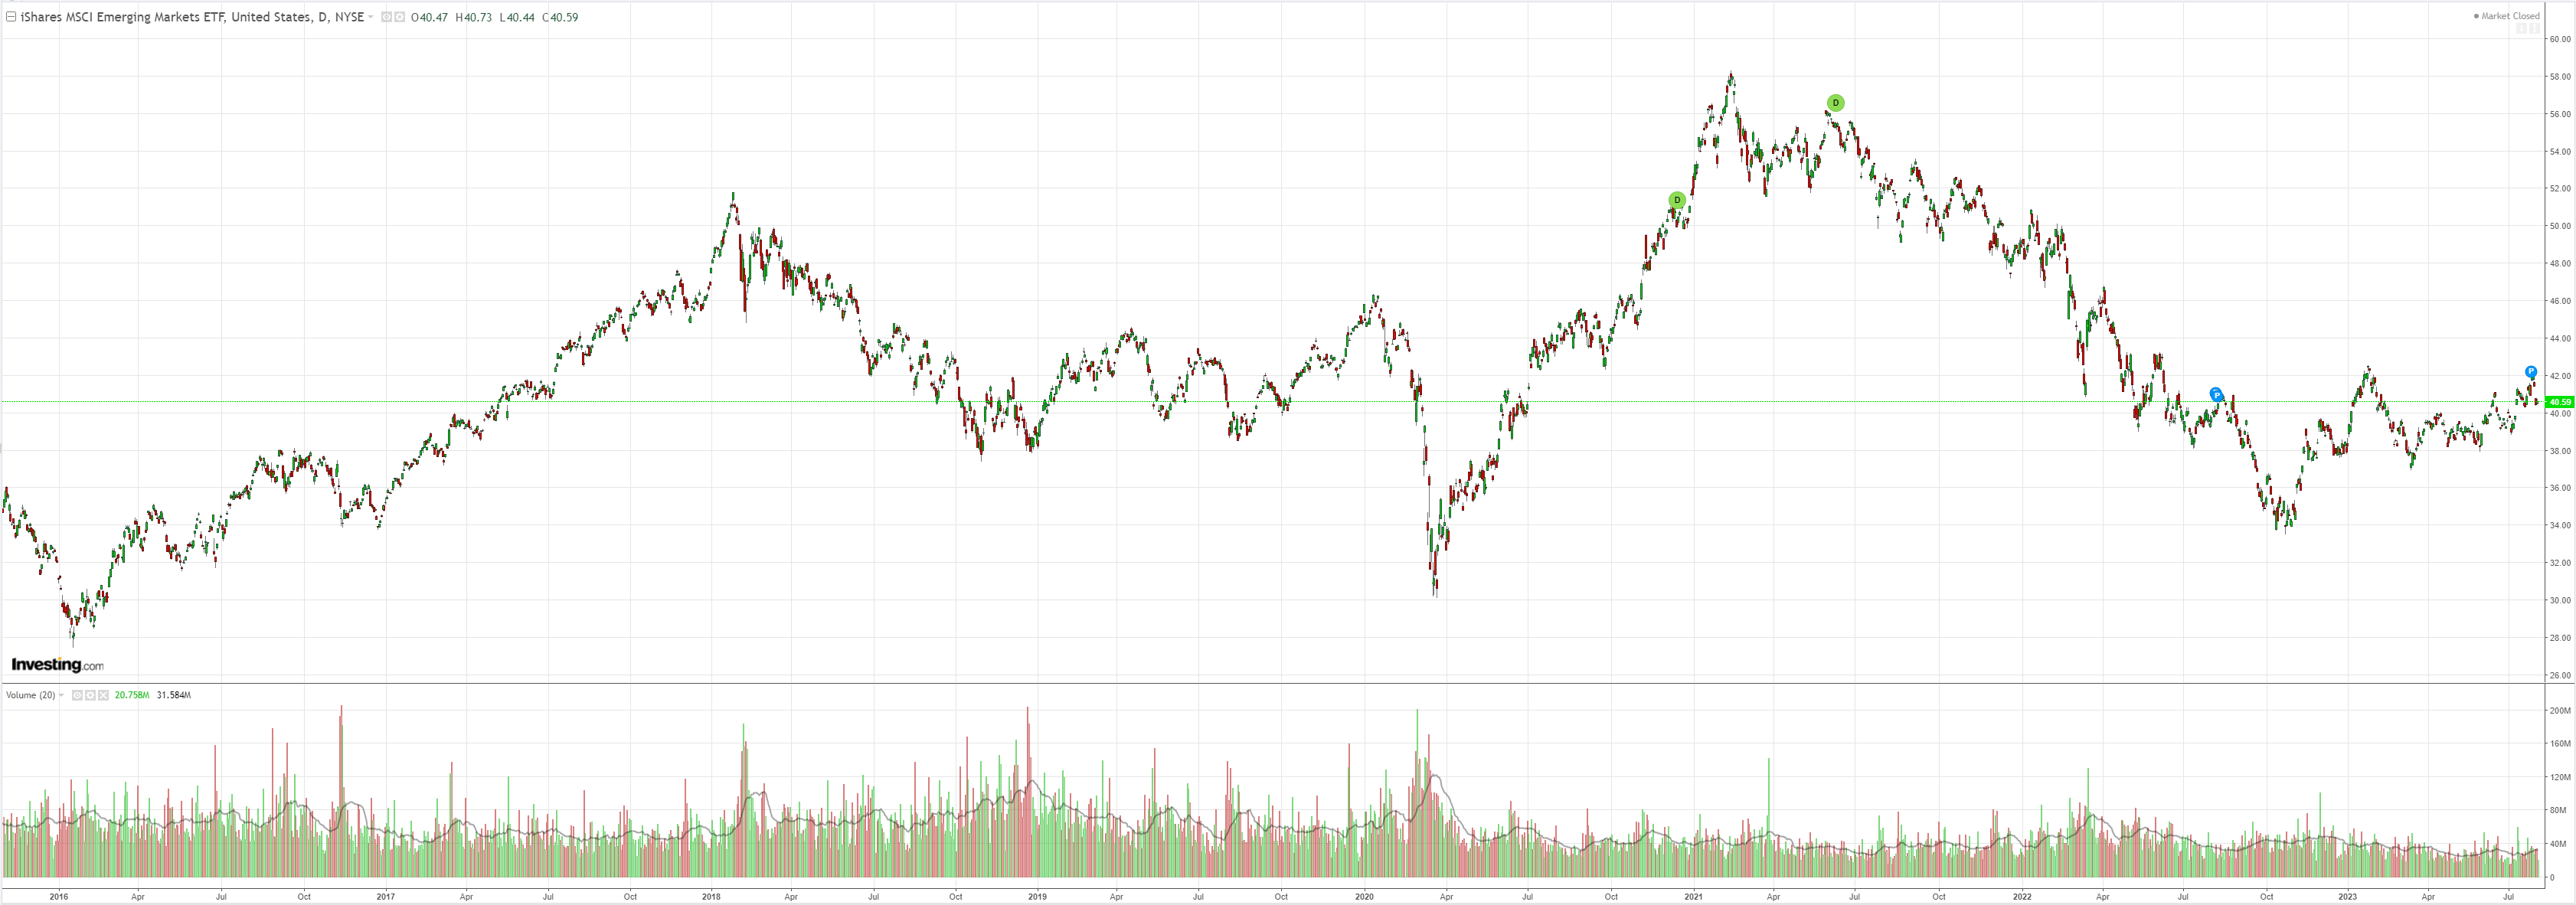
EM (NYSE:EEM) is dead:
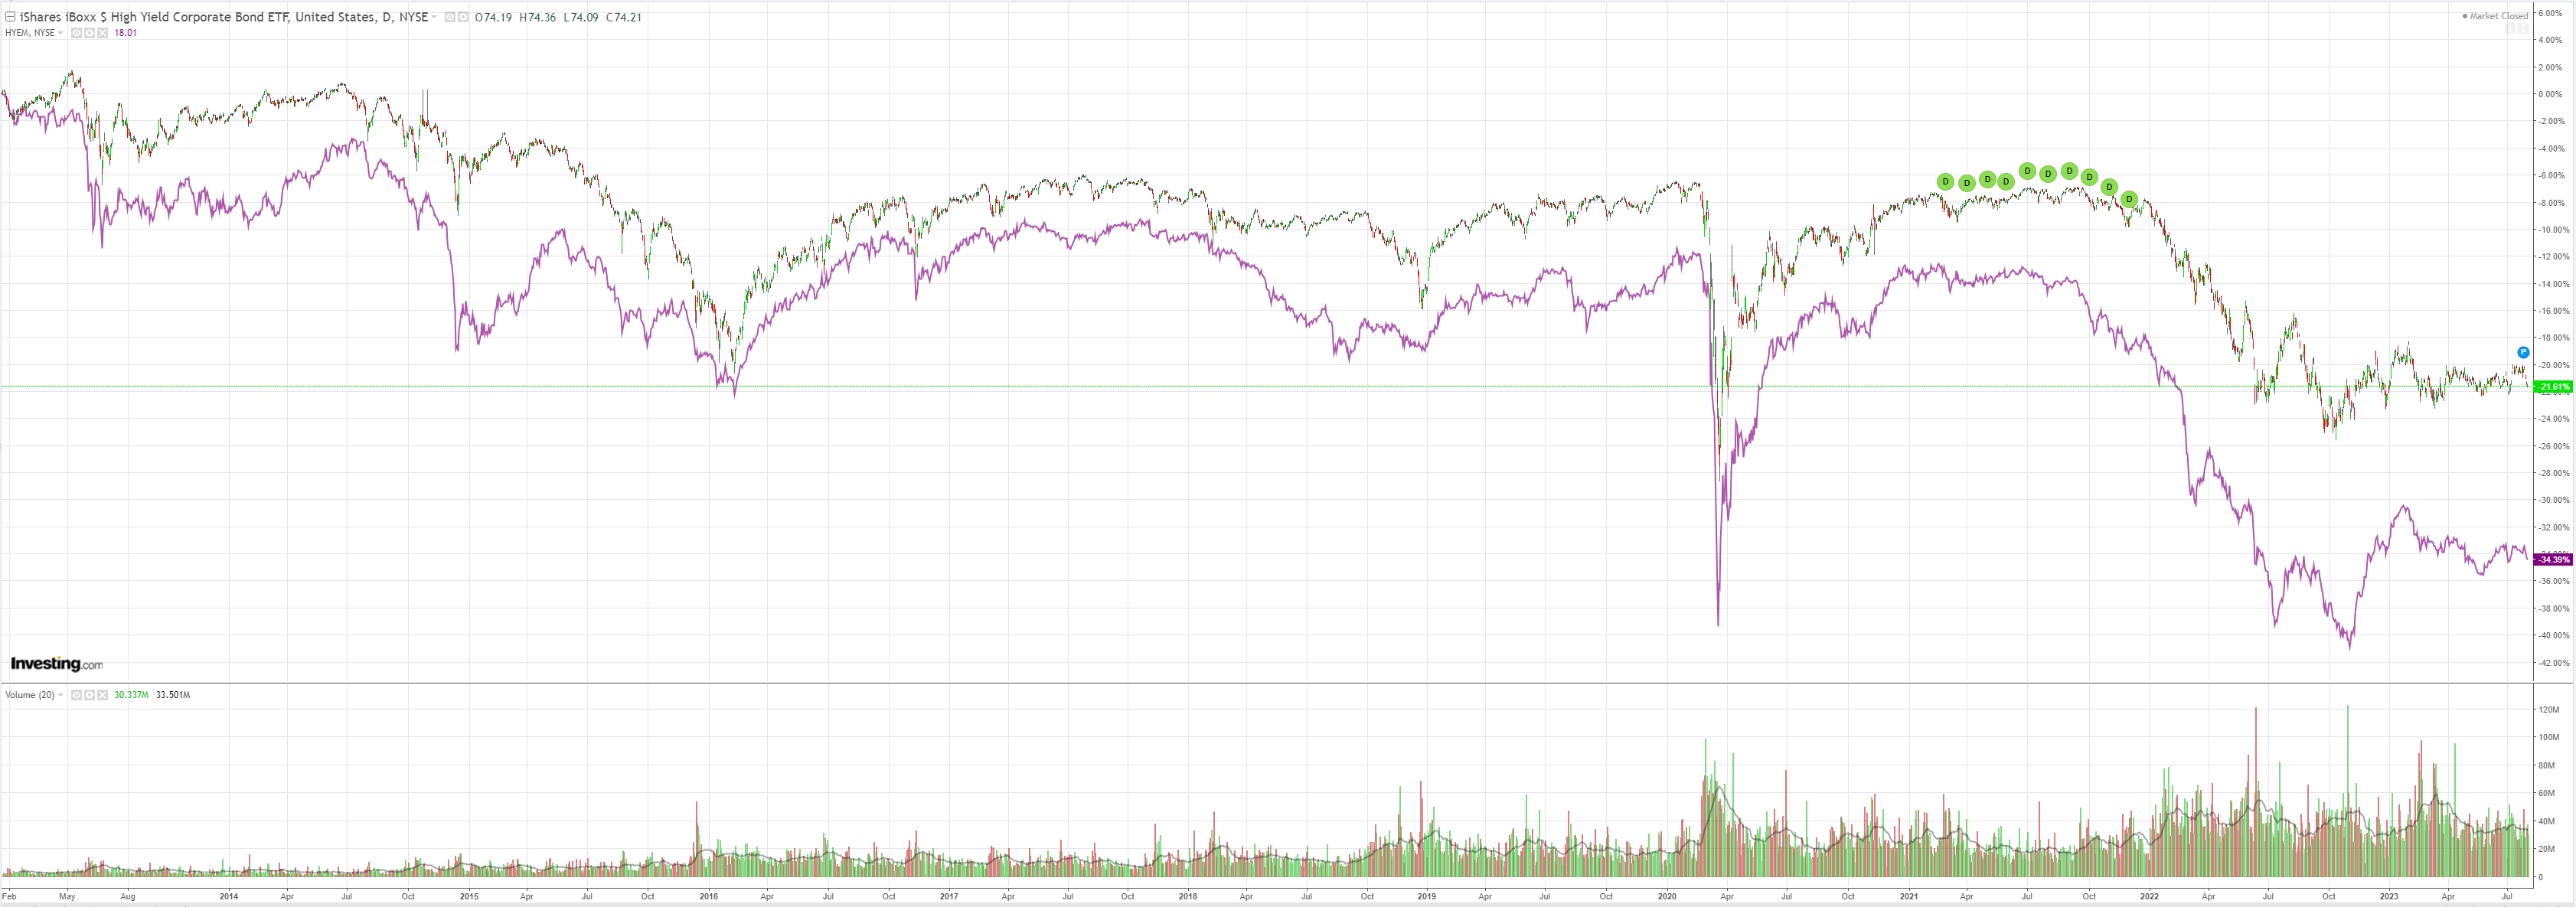
Junk (NYSE:HYG) is not happy:
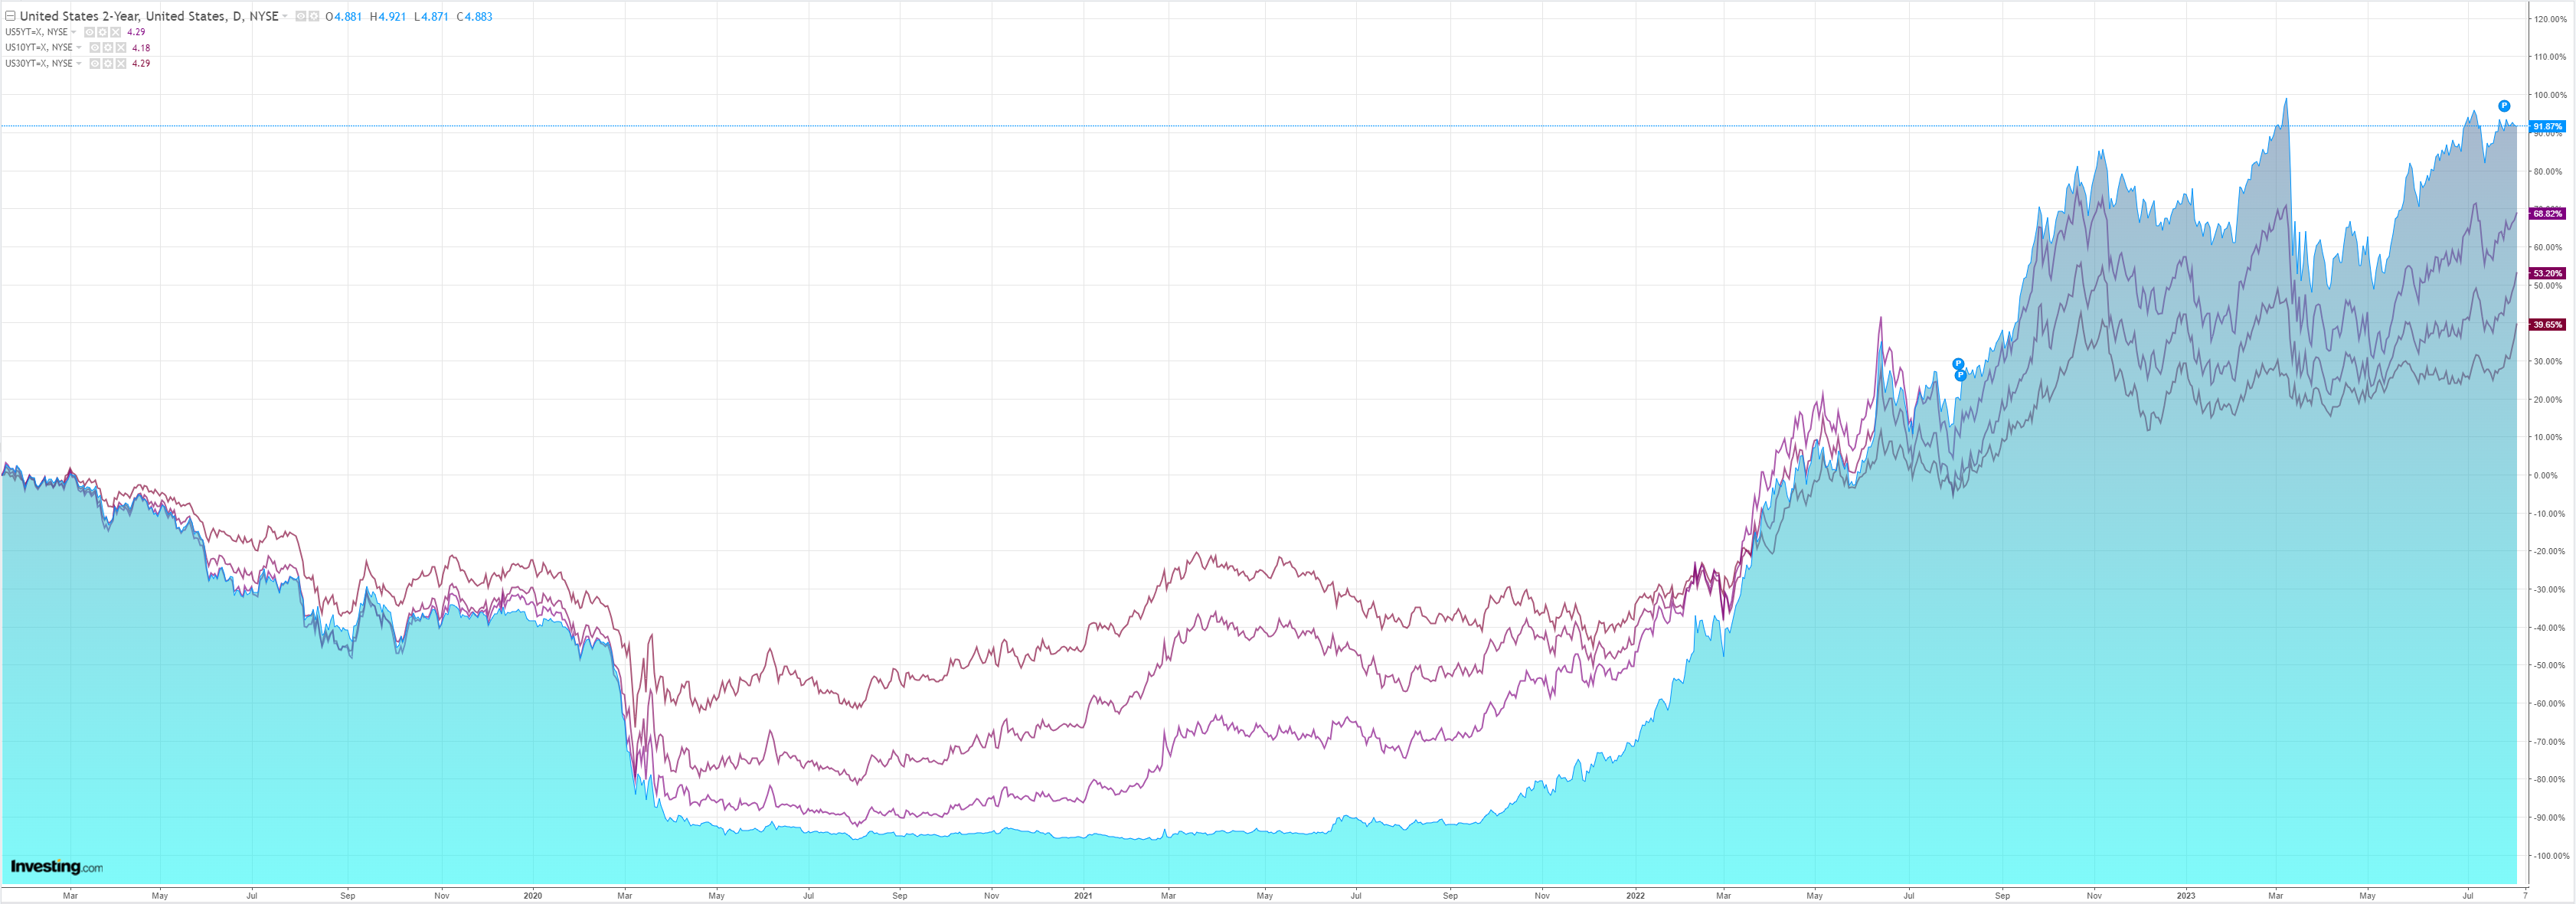
A bear steepener is warning the Fed is not done:
Which stocks are not prepared for:
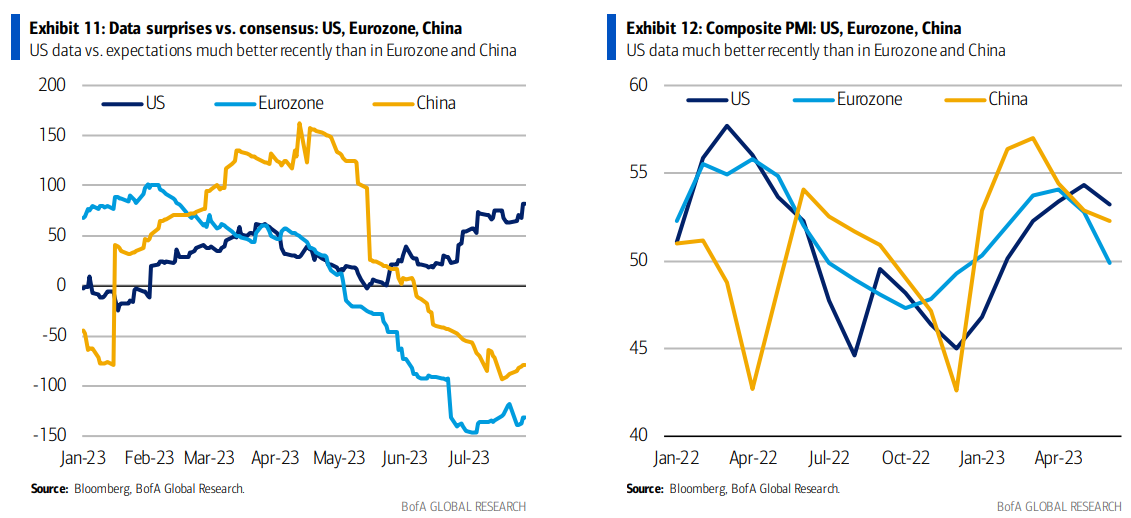
BofA sums up where we are nicely. No AUD joy here.
Since the first quarter, US data has been much better compared with data in the Eurozone and in China. US data has consistently surprised market expectations upwards, while Eurozone and China data have consistently surprised market expectations downwards (Exhibit 11). Purchasing Managers’ Indexes(PMIs)show weakening in all three, but much less in the US than in the Eurozone and in China (Exhibit 12).
Broadening the macro comparisons to the rest of G10 shows the extent of divergence. We take our growth forecasts for G10 and add the difference between the latest core inflation from the 2% target. We assume that central banks care both about growth and inflation. Although the weights may differ according to each central bank’s mandate, this measure should be a good-enough proxy of possible overheating pressures vs. recession risks. This analysis shows strong data in Norway and in the UK and weak data in Japan and Switzerland (Exhibit 13). It would therefore point to positive risks for NOK and GBP vs. CHF and JPY.
Comparison between this macro measure and rates market pricing shows no correlation, which in turn suggests market mispricing. Exhibit 14 looks at rates market pricing for the next 12 months. The correlation should be positive in theory—better macro data, more hikes/less cuts—but this does not seem to be the case. The market seems to be pricing too much for the UK and not enough (or pricing too many cuts, too early) for the US, New Zealand and, up to an extent Norway, always relatively to the data. This analysis is bullish USD, NZD, NOK vs. GBP, CHF. Although it would appear that market pricing for the rest of G10 seems to be consistent with the data, the very weak correlation
suggests that this is not necessarily the case. For example, our measure is higher for AUD and SEK than for JPY and CAD, with EUR in the middle, but market pricing if broadly similar.
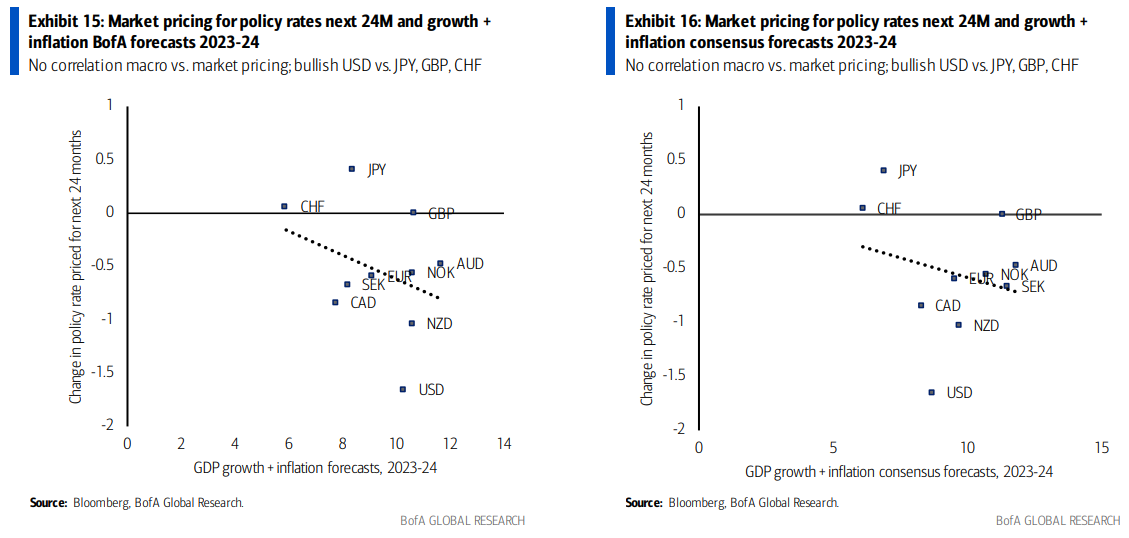
Looking at the macro outlook and rates market pricing for a longer period shows potential for even more market mispricing. Exhibit 15 adds our growth and inflation forecasts for 2023-24 (we assume that core and headline inflation converge in the longer term) and compares it with rates market pricing for the next 24 months. The correlation is even wrong—negative. This does not change much when we use consensus forecasts instead our ours in Exhibit 16. This analysis suggests that the market may not be pricing enough for the Fed and may be pricing too much for the BoJ, the SNB and the BoE. Indeed, we expect the Fed to start cutting rates later and slower than market pricing, the BoJ to stick with unconventional monetary policies for longer, the BoE to hike by less than market pricing—50bp vs 84bp—and the SNB to already have reached its terminal rate (see themes below for more details on the Fed and the BoJ). Our analysis is therefore bullish USD vs. JPY, CHF and GBP, at least until rates market pricing adjusts accordingly. Our analysis is also bearish EURUSD, as the market seems to be pricing enough for the ECB, but not enough for the Fed—primarily because the market is pricing early Fed cuts.
