Morgan Stanley (NYSE:MS) today notes the risks to Australian trade in the China crash.
The slowdown in China’s medium-term growth will spill over to the rest of the world via four channels: trade, commodity prices, MNCs’ operations in China, and financial conditions. In our base case, we see the slowdown unfolding gradually, not disruptively.
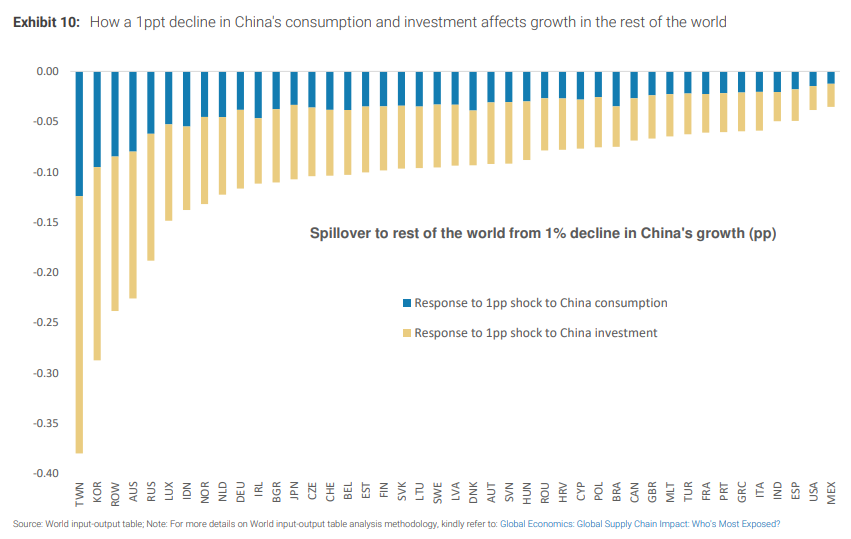
We expect China’s real GDP growth to slow from 4.7% in 2023 to 4.2% in 2024 and an average of 3.6% over 2025-27. This will mean manageable spillover effects for the rest of Asia, in aggregate. Using an input-output approach, we estimate that each 1ppt decline in China’s growth rate would reduce growth in other Asian economies by 15bps. East Asian economies, with even closer trade links, would face greater pressure on growth, though there will be some offset from weaker commodity prices.

Australia also stands out given its exports of iron ore, which are highly exposed to China’s property and infrastructure sectors. Other commodity exporters like Indonesia and Malaysia are less affected on a relative basis, as they mostly export energy and food to China. India is least exposed and has strong domestic demand alpha, providing a good offset. In the bear case scenario of a debt-deflation loop in China, China’s nominal GDP growth would decelerate even more sharply and in turn weigh on regional nominal GDP growth, particularly in economies with high debt levels and weakening demographics, such as Hong Kong, Japan, Korea, Singapore, Taiwan, and Thailand.
What slower growth in China means for the rest of Asia: Our chief economist for China, Robin Xing, expects 4.7% GDP growth in 2023 and recently lowered his medium-term growth forecasts. In this report, we detail the exposures and assess the medium-term implications for the rest of Asia.

How slower growth will be transmitted: China’s regional neighbours will be affected via trade, commodity prices, MNC operations in the country, and financial conditions. China accounts for 23% of the rest of Asia’s exports, and six out of 10 economies in the region run a trade surplus with China & Hong Kong. It also accounts for 40-60% of global demand for commodities like steel, aluminium, copper, and coal. Global MNCs have significant exposure as well via their operations in the country, while 11.2% of company revenues in Asia (ex China and Japan) are sourced from China. From an equity market standpoint, the correlation between China and the rest of Asia stands at 47%, while the betas of Asian currencies with USDCNH range from 0.3 for INR to 1.2 for THB. Asia thus remains the most exposed region to a slowdown in China, even if that exposure has moderated in recent years.

The medium-term drag should be moderate and manageable: Our base case is for a gradual slowing in China’s growth momentum to an average of 3.6% over 2025-27, from 4.7% in 2023 and 4.2% in 2024. Our input-output analysis suggests that each 1ppt slowdown in China’s real GDP growth would reduce Asia ex China growth by 15bps. Economies like Korea and Taiwan are more exposed and would face 30-35bps growth downside, but the drag on larger economies like Japan and India would be a third of that.

Moreover, overlaying this analysis with our view on the growth dynamics, we believe that the larger economies like India, Indonesia, and Japan have idiosyncratic factors which allow them to generate domestic demand alpha, which will act as an offset.
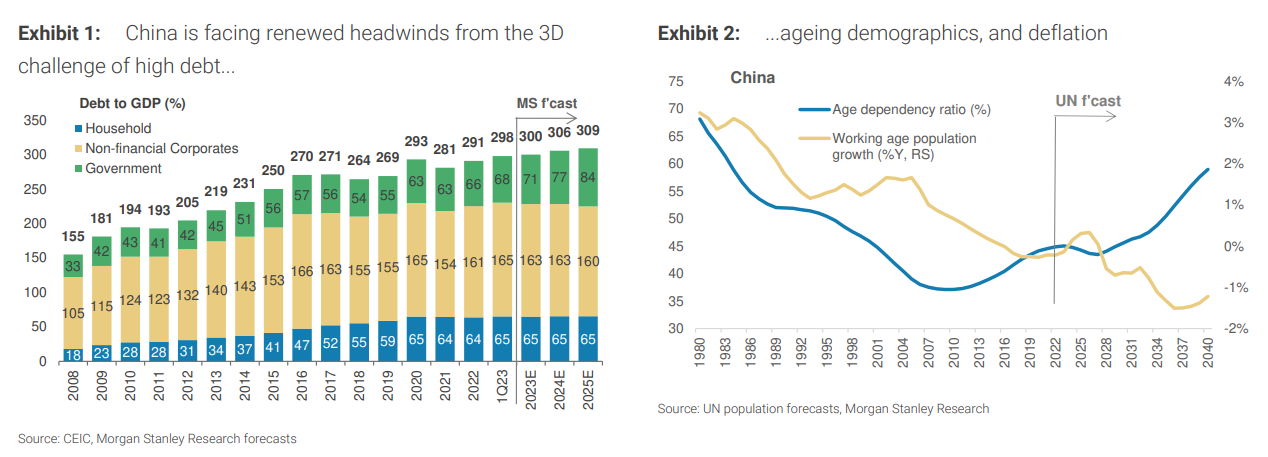
What if China falls into a debt-deflation loop? As we have highlighted before, the risks of China falling into a debt-deflation loop are significant. In our bear case scenario, real GDP growth could decelerate to just 2.8% over 2025-27, with nominal GDP growth even weaker at 2.2%. Hence, we are mindful that the region could yet face further downside risks to growth. Disinflationary pressures emanating from China will weigh on the rest of the region’s nominal GDP growth as well.
We have seen this before in 2015. When bulk commodities fall substantially the national income shock plays out in weak nominal growth, falling inflation and wage growth, plus rising tax rates.
This leads to falls in the RBA cash rate and the AUD.
The difference this time is that it is permanent.
As it plays out, the Australian economy must undertake an equally structural adjustment via a lower AUD for longer.
