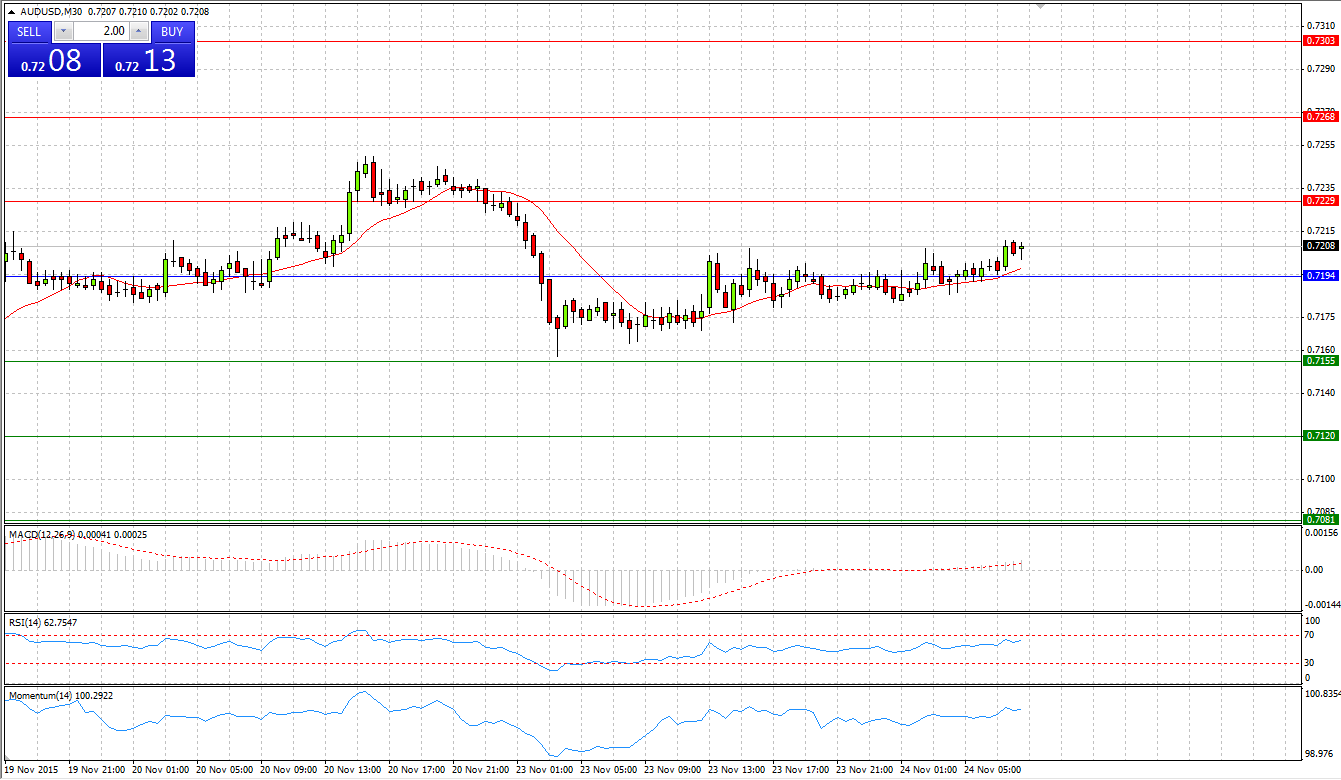
Market Scenario 1: Long positions above 0.7194 with targets at 0.7229 & 0.7268
Market Scenario 2: Short positions below 0.7194 with targets at 0.7155 & 0.7120
Comment: Bulls managed to stop the fall of AUD/USD during yesterday’s session at 0.7157, since then the pair was in an upwards move. Currently AUD/USD is trading above Pivot Point level.
Supports and Resistances:
R3 0.7303
R2 0.7268
R1 0.7229
PP 0.7194
S1 0.7155
S2 0.7120
S3 0.7081
EUR/JPY
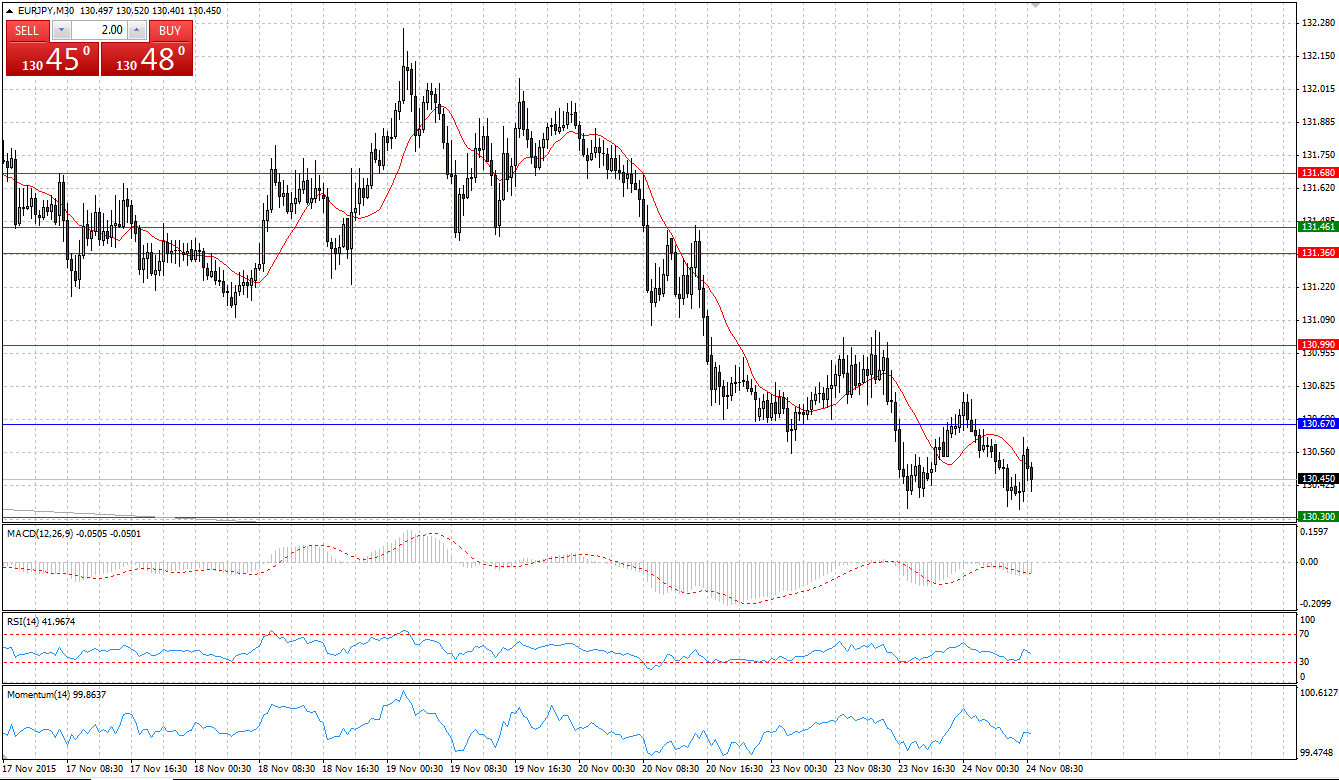
Market Scenario 1: Long positions above 130.67 with targets at 130.99 & 131.36
Market Scenario 2: Short positions below 130.67 with targets at 130.30 & 129.98
Comment: European currency continue depreciating against Japanese Yen reaching a new low at 130.33 during yesterday’s session. Currently EUR/JPY is trading below the Pivot Point level.
Supports and Resistances:
R3 131.68
R2 131.36
R1 130.99
PP 130.67
S1 130.30
S2 129.98
S3 129.61
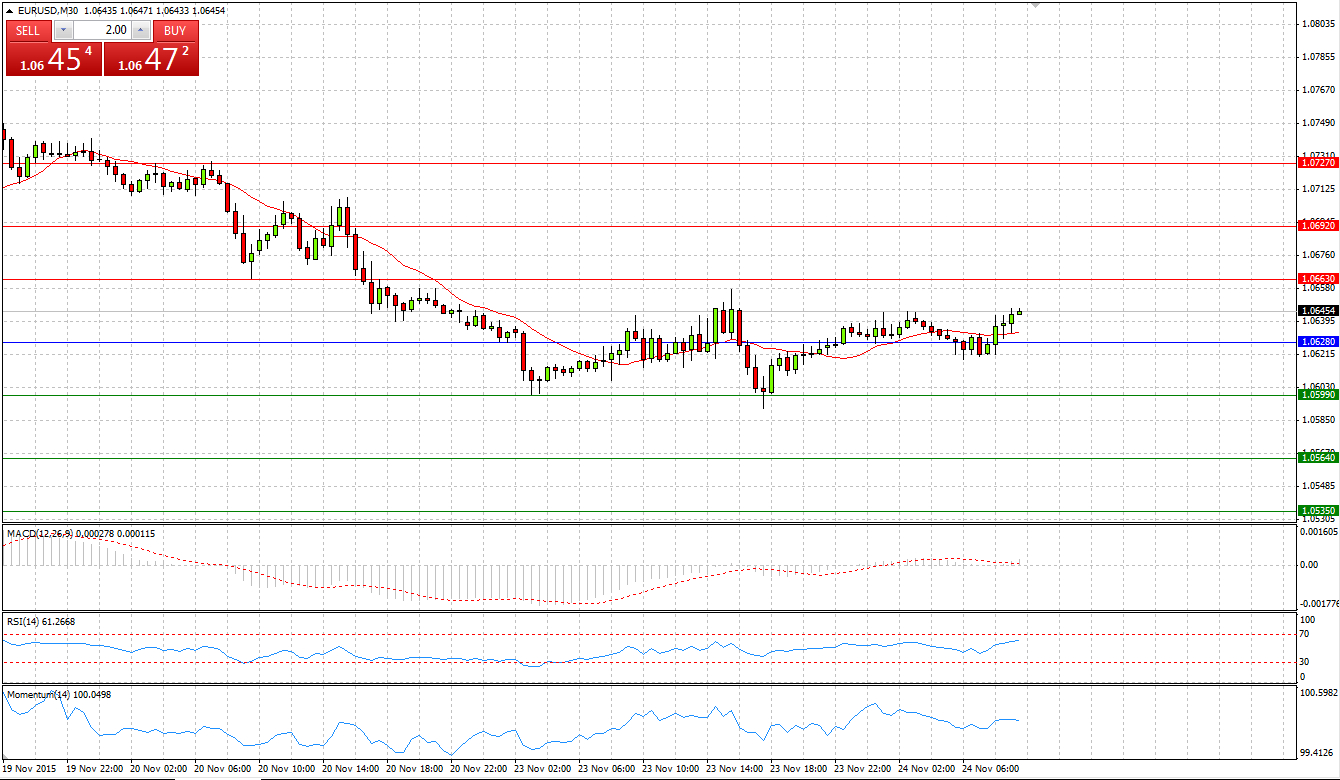
Market Scenario 1: Long positions above 1.0628 with targets at 1.0663 & 1.0692
Market Scenario 2: Short positions below 1.0628 with targets at 1.0599 & 1.0564
Comment: European currency reached a new low at 1.05917 during yesterday’s session against US dollar. Dovish comments of ECB President Mario Draghi continue having negative impact on single currency. At the time being the pair managed to break through the Pivot Point level and aiming to test R1.
Supports and Resistances:
R3 1.0727
R2 1.0692
R1 1.0663
PP 1.0628
S1 1.0599
S2 1.0564
S3 1.0535
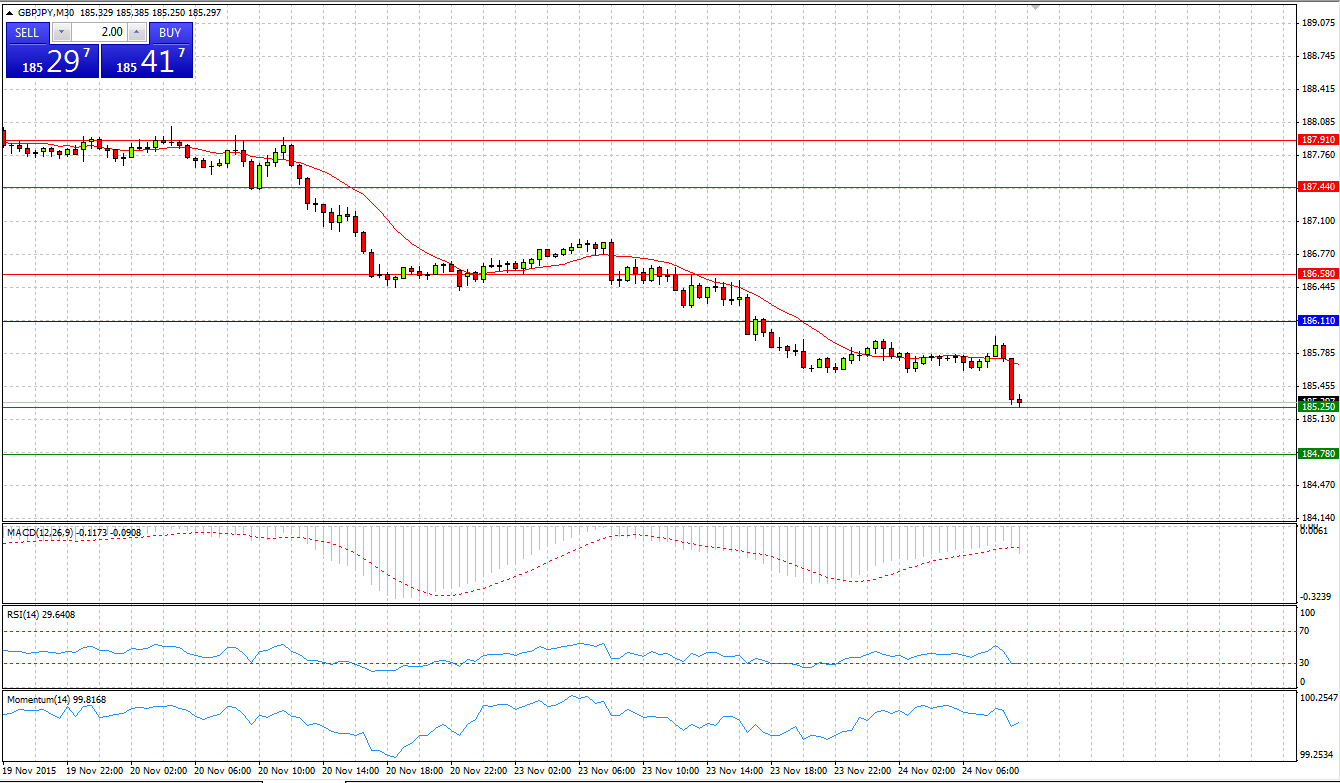
Market Scenario 1: Long positions above 186.11 with targets at 186.58 & 187.44
Market Scenario 2: Short positions below 186.11 with targets at 185.25 & 184.78
Comment: Sterling continues losing its positions against Japanese Yen for the third day in the row. Currently the pair is testing the First Support level at 185.25
Supports and Resistances:
R3 187.91
R2 187.44
R1 186.58
PP 186.11
S1 185.25
S2 184.78
S3 183.92
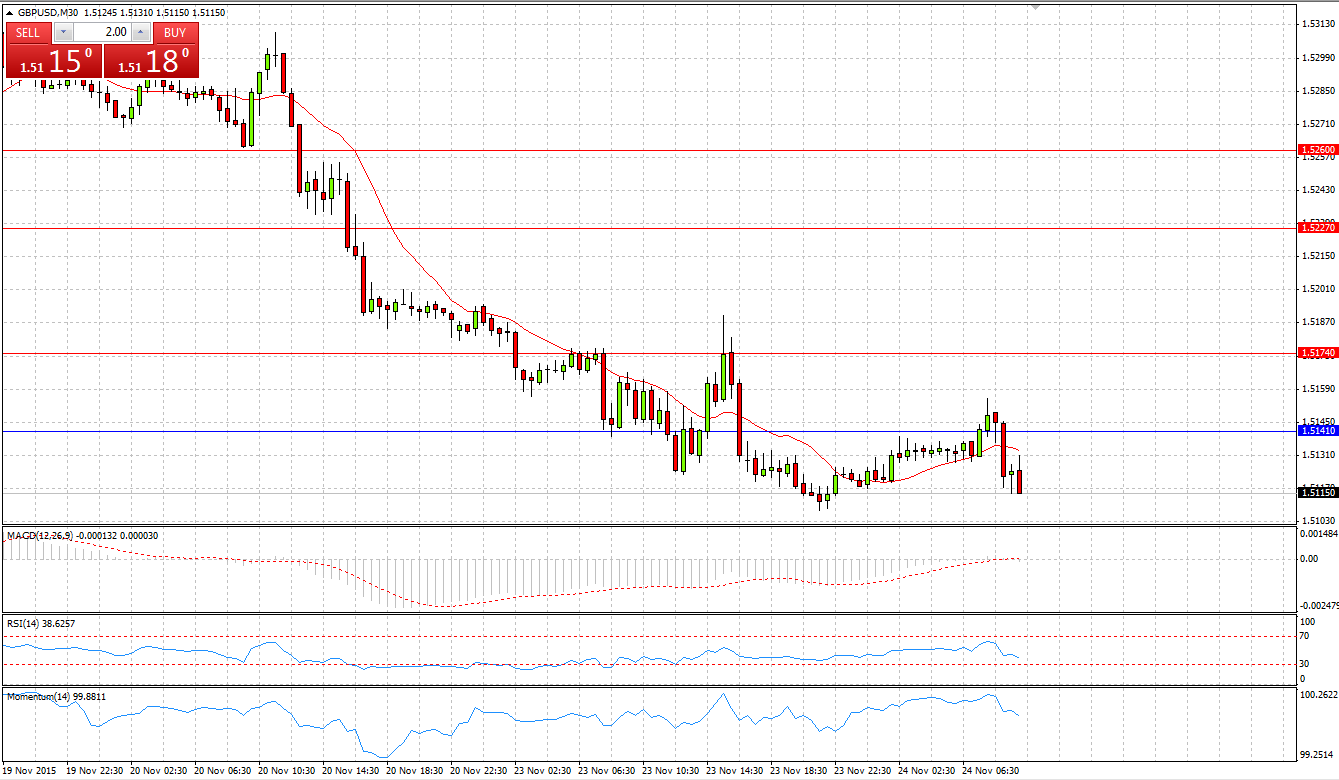
Market Scenario 1: Long positions above 1.5141 with targets at 1.5174 & 1.5227
Market Scenario 2: Short positions below 1.5141 with targets at 1.5088 & 1.5055
Comment: Sterling continued dropping against US dollar during yesterday’s session closing the day with more than 70 pips loss. Today the pair is trading flat UK’s Inflation reports and US GDP and Consumers confidence.
Supports and Resistances:
R3 1.5260
R2 1.5227
R1 1.5174
PP 1.5141
S1 1.5088
S2 1.5055
S3 1.5002
USD/JPY
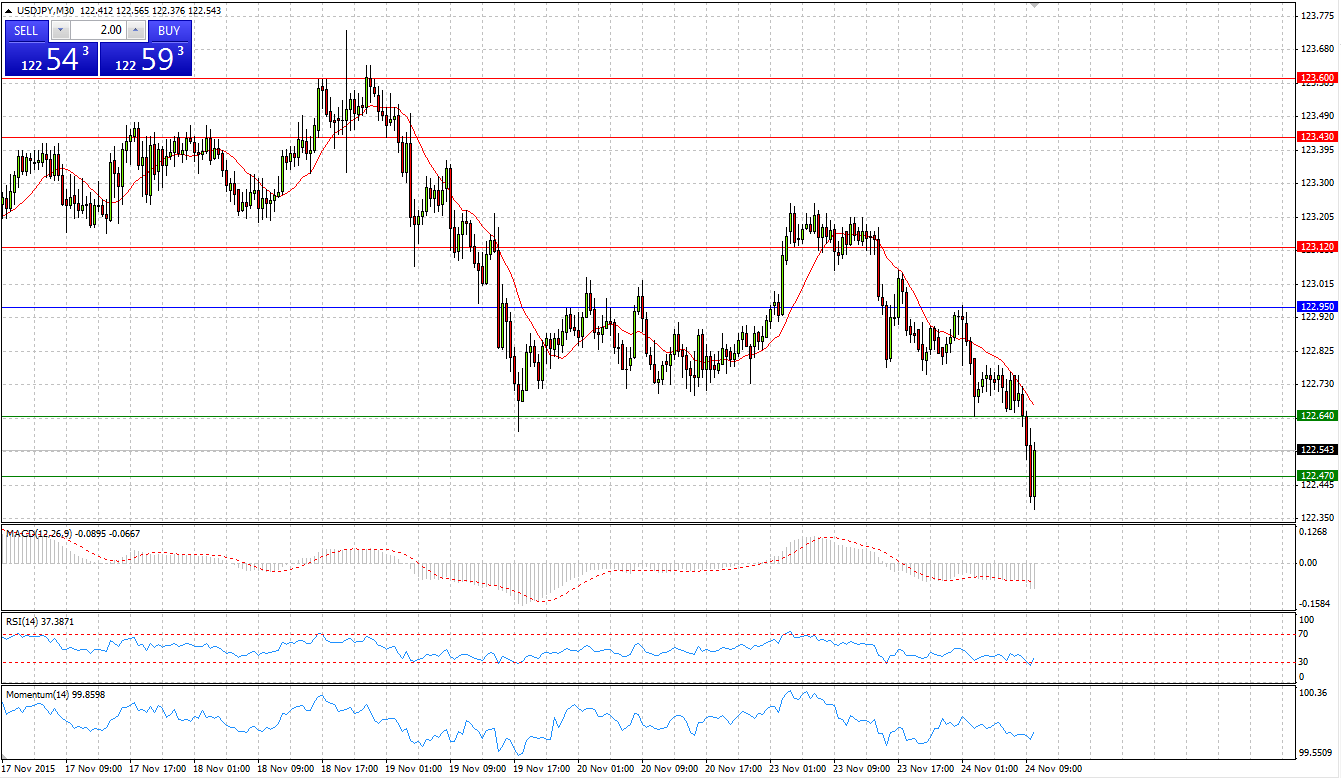
Market Scenario 1: Long positions above 122.95 with targets at 123.12 & 123.43
Market Scenario 2: Short positions below 122.95 with targets at 122.64 & 122.47
Comment: During yesterday’s session USD/JPY undertook an attempt to test the First and the Second Resistance levels, however, encountering selling pressure the pair was pushed back, closing the day with no results. During early Asian session the pair was sent below Pivot Point level and successfully broke the First Support level and tested the Second one.
Supports and Resistances:
R3 123.60
R2 123.43
R1 123.12
PP 122.95
S1 122.64
S2 122.47
S3 122.16
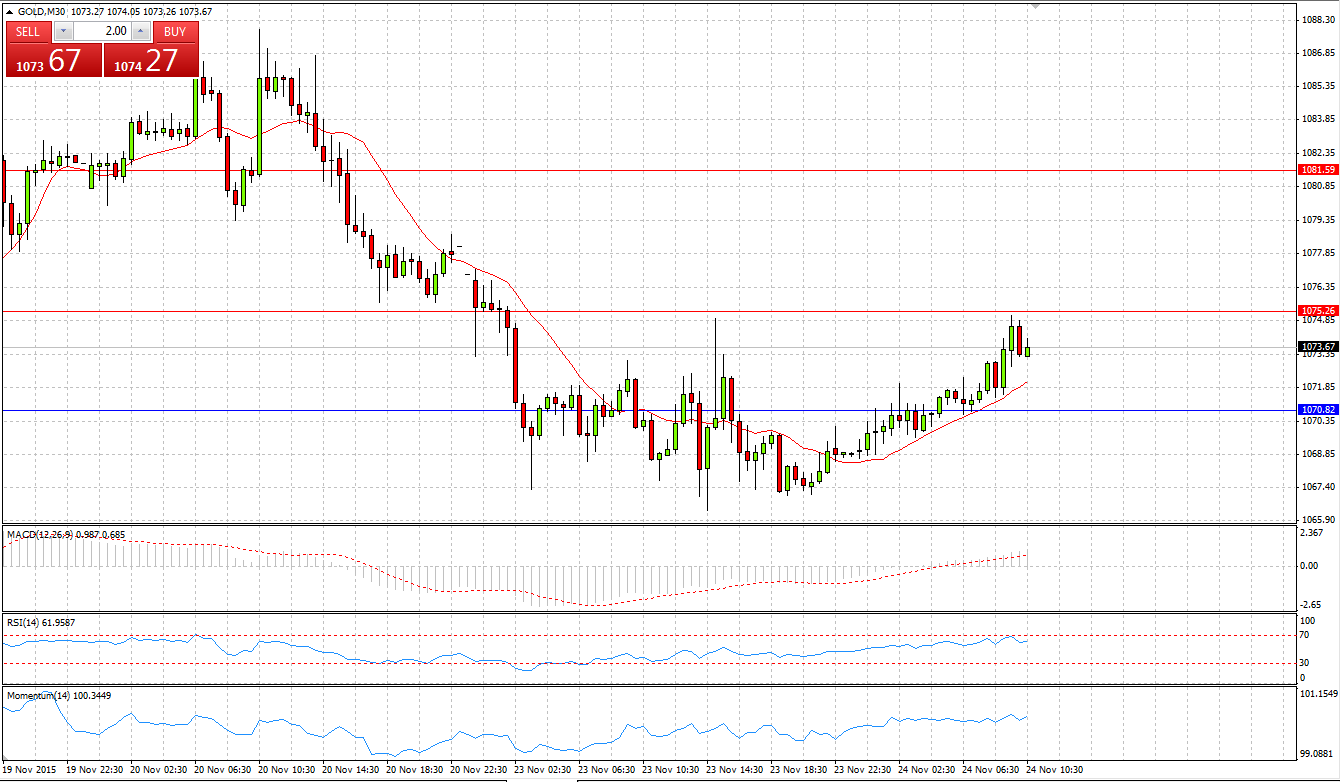
Market Scenario 1: Long positions above 1070.82 with targets at 1075.26 & 1081.59
Market Scenario 2: Short positions below 1070.82 with targets at 1064.49 & 1060.05
Comment: Bears struggling to send Gold prices below the First Support level, however, the level managed to sustain the pressure. Currently Gold is trading positively above Pivot Point level.
Supports and Resistances:
R3 1092.36
R2 1081.59
R1 1075.26
PP 1070.82
S1 1064.49
S2 1060.05
S3 1049.28
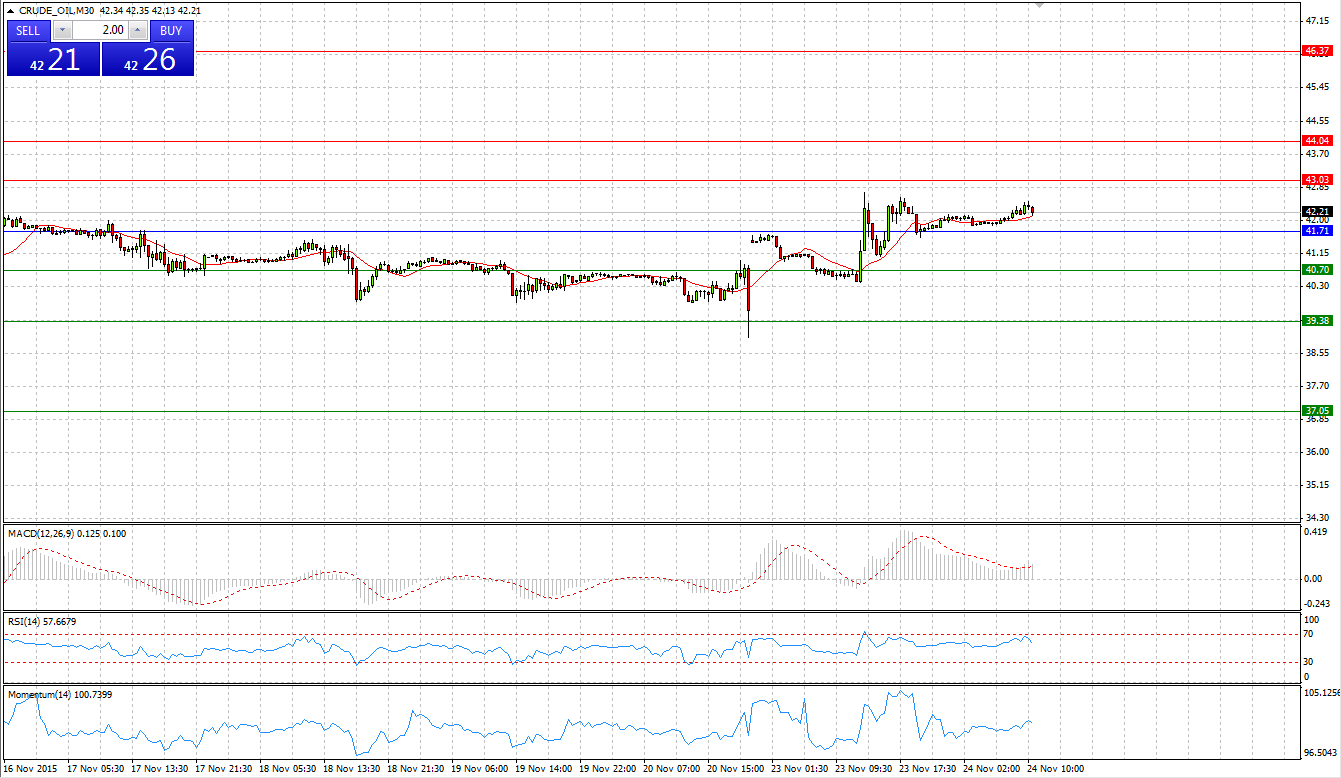
Market Scenario 1: Long positions above 41.71 with targets at 43.03 & 44.04
Market Scenario 2: Short positions below 41.71 with targets at 40.70 & 39.38
Comment: Crude supported by Saudi Arabia’s pledge to work with global oil producers in an effort to stabilize prices closed yesterday’s session with 54 cents profit. Saudi Arabia’s comments come ahead of the Organization of the Petroleum Exporting Countries’ scheduled Dec. 4 meeting in Vienna. Currently Crude is trading above Pivot Point level.
Supports and Resistances:
R3 46.37
R2 44.04
R1 43.03
PP 41.71
S1 40.70
S2 39.38
S3 37.05
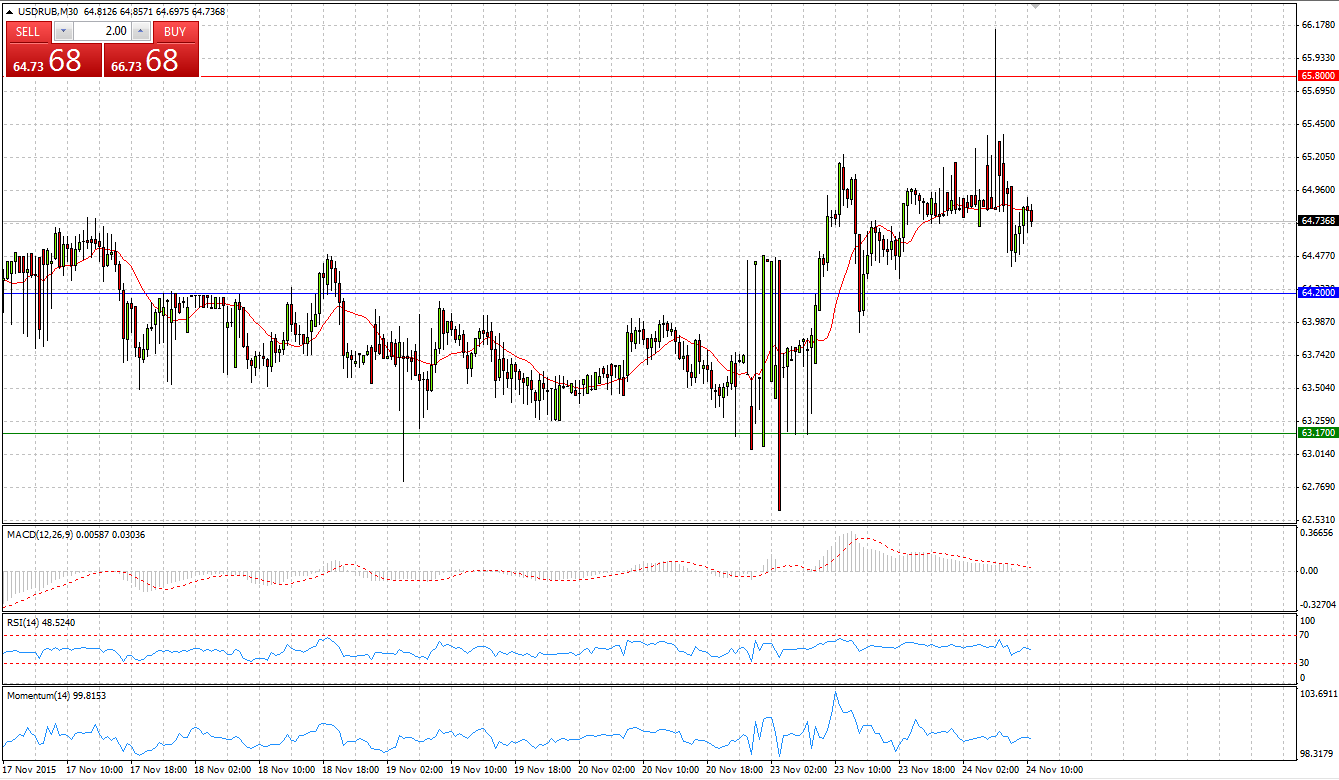
USD/RUB
Market Scenario 1: Long positions above 64.20 with targets at 65.80 & 66.83
Market Scenario 2: Short positions below 64.20 with targets at 63.17 & 61.57
Comment: USD/RUB during today’s session reached a new high at 66.15, however encountered selling pressure the pair was sent to its opening price. Currently USD/RUB is trading slightly above Pivot Point level.
Supports and Resistances:
R3 69.46
R2 66.83
R1 65.80
PP 64.20
S1 63.17
S2 61.57
S3 58.94
