It seems consumers are keen to get back to shopping. As economies are reopening following COVID-19 lockdowns, shoppers are returning to stores, although there are some changes to the way they are spending.
In April, the Conference Board's Consumer Confidence Index increased to 121.7 from 109 in March brining the metric to its highest level since February 2020.
Meanwhile, the markets are waiting for the April 2021 Advance Monthly Retail Report, which will be released May 14 by the Census Bureau. The report for March shows that retail and food services sales were up by 9.8% in March from February 2021 and 27.7% year-over-year (YoY).
According to recent consumer research by the National Retail Federation:
"Over nine in 10 [consumers] are likely to choose a retailer based on convenience, and these shoppers are looking to retailers to help them save even more time and effort in their busy lifestyles."
In March, the European Commission also announced data on recent consumer behavior. The findings suggest:
"71% of consumers shopped online in 2020 ... 56% of consumers said environmental concerns influenced their purchasing decisions and 67% said that they bought products that were better for the environment, even if such products were more expensive."
Against that backdrop, we introduce two exchange-traded funds (ETFs) that could be appropriate for readers who believe robust consumer confidence will translate into higher returns in retail shares.
1. Global X E-Commerce ETF
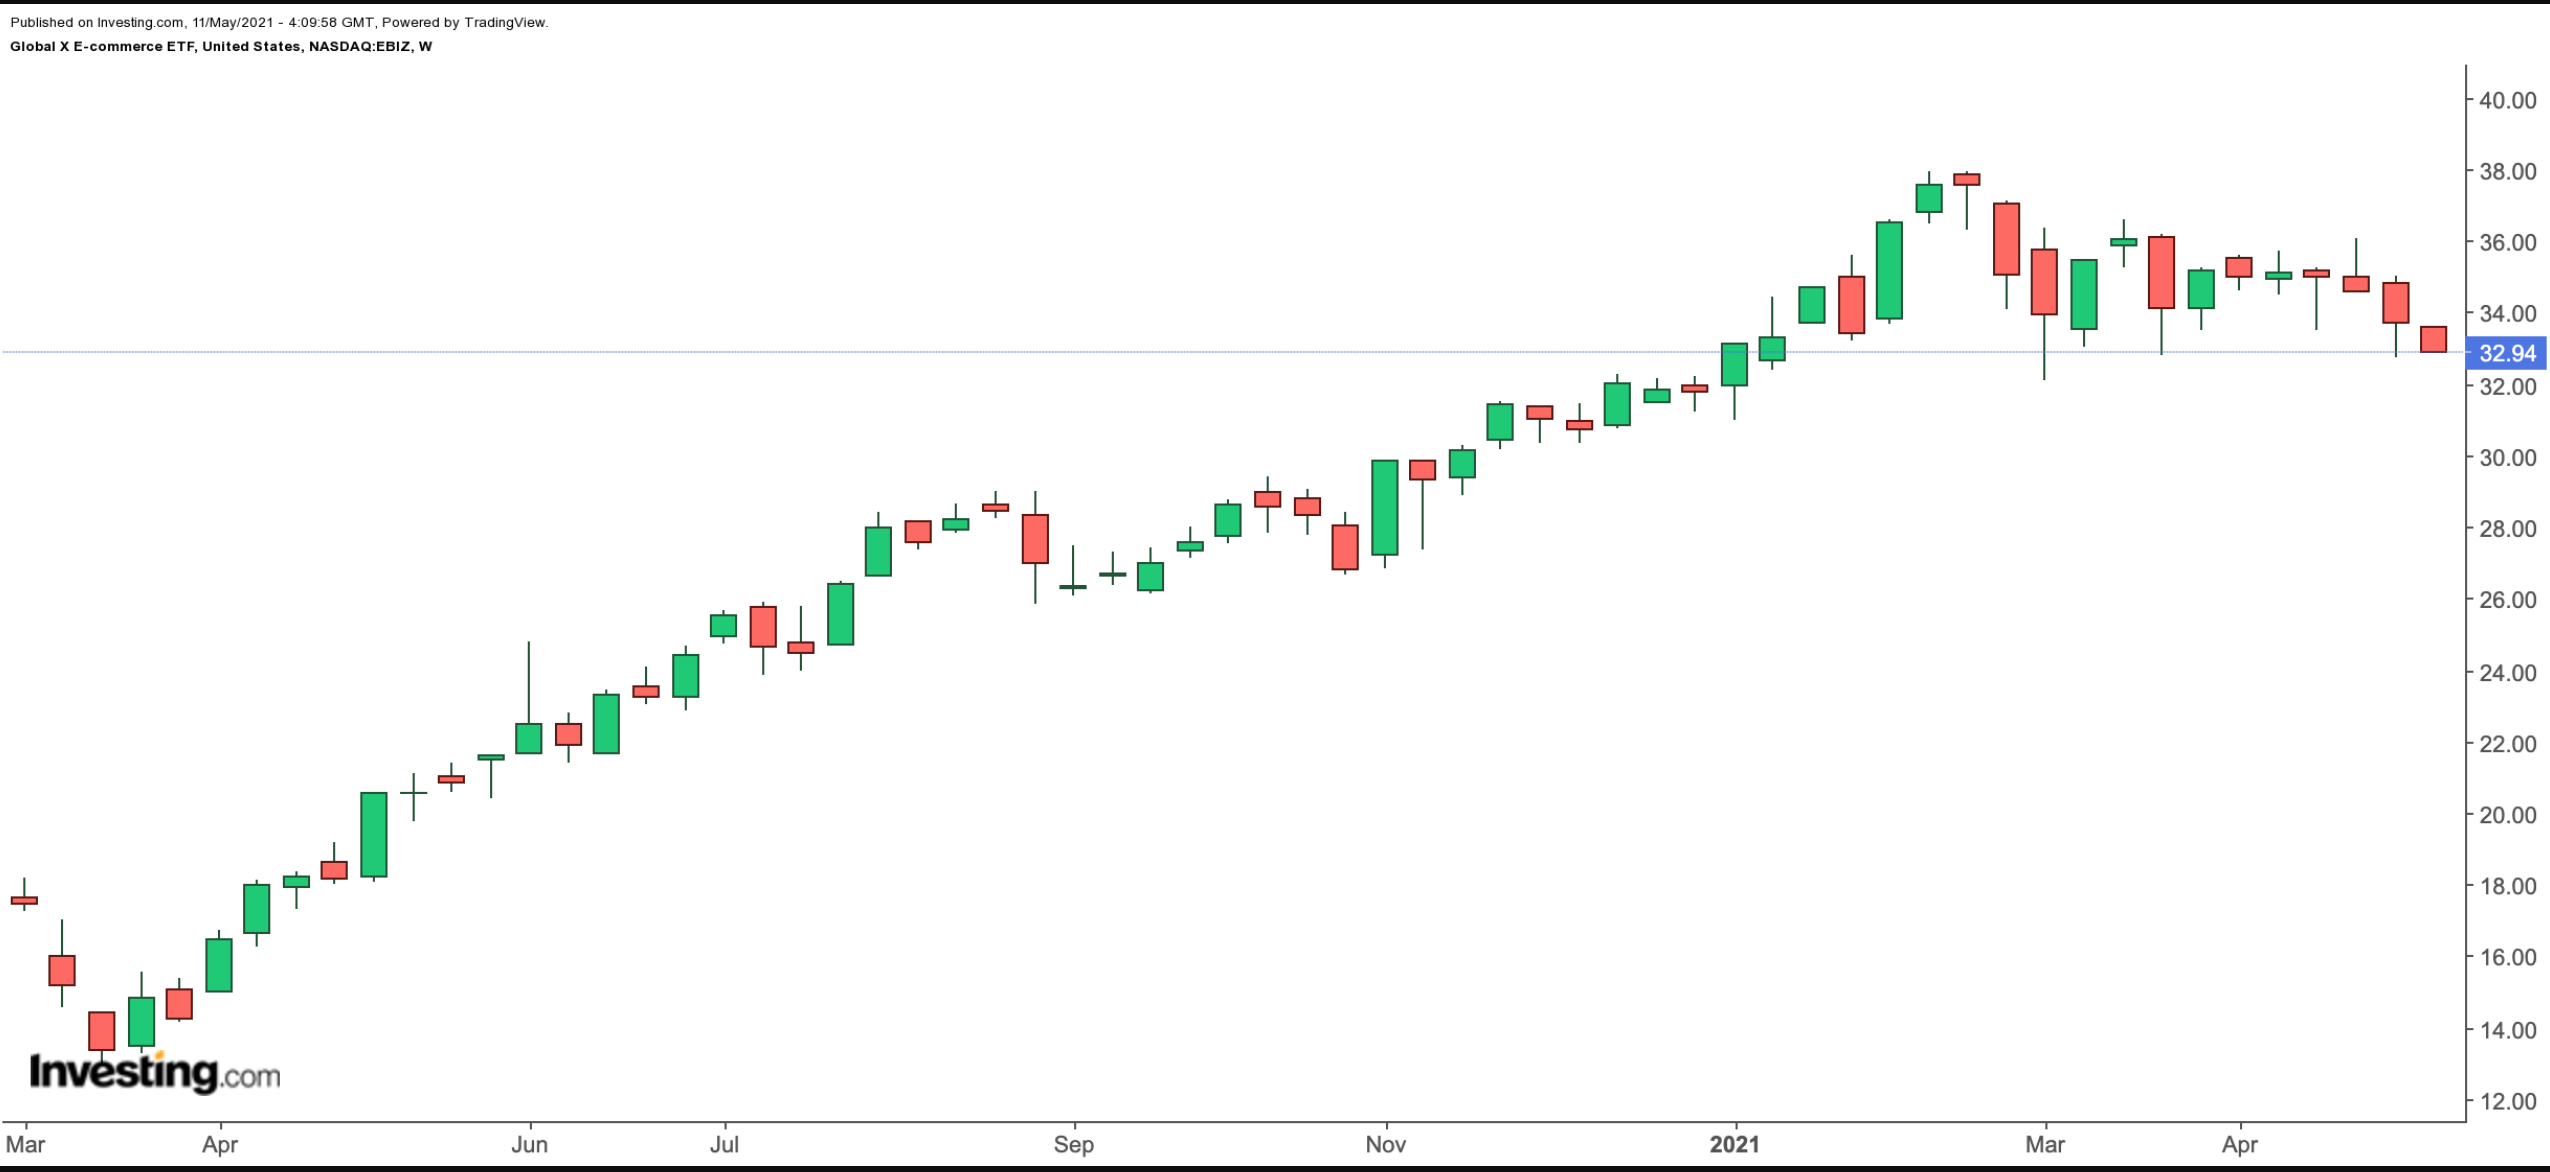
- Current Price: $32.94
- 52-Week Range: $19.75 - $37.98
- Dividend Yield: 0.40%
- Expense Ratio: 0.50% per year
The Global X E-commerce ETF (NASDAQ:EBIZ) invests in global businesses that are likely to benefit from increased online shopping worldwide. These companies include e-commerce platforms, providers of related technologies and software, as well as bricks-and-mortar retailers that have an online presence. The fund started trading in November 2018 and has $233.8 million in net assets.

EBIZ, which tracks the returns of the Solactive E-commerce Index, currently has 41 different holdings. Close to 55% of the companies come from the US. Next in line are businesses from China (25.5%), the UK (5.8%) and Japan (5.1%). The consumer discretionary sector has the largest slice (68.2%), followed by consumer services (22.3%) and industrials (5.5%).
The top 10 names comprise close to 46% of the fund. Homeware retailer Williams-Sonoma (NYSE:WSM), Japanese online marketplace Rakuten (OTC:RKUNY), online travel company Expedia (NASDAQ:EXPE) and e-commerce and cloud services giant Amazon (NASDAQ:AMZN) are among the leading names on the roster.
Since the start of the year, EBIZ is up about 4% and hit a record high in early February. The fund has given up some of its recent gains; interested investors could regard any further drop toward $30 as a potential point of entry.
2. SPDR® S&P Retail ETF
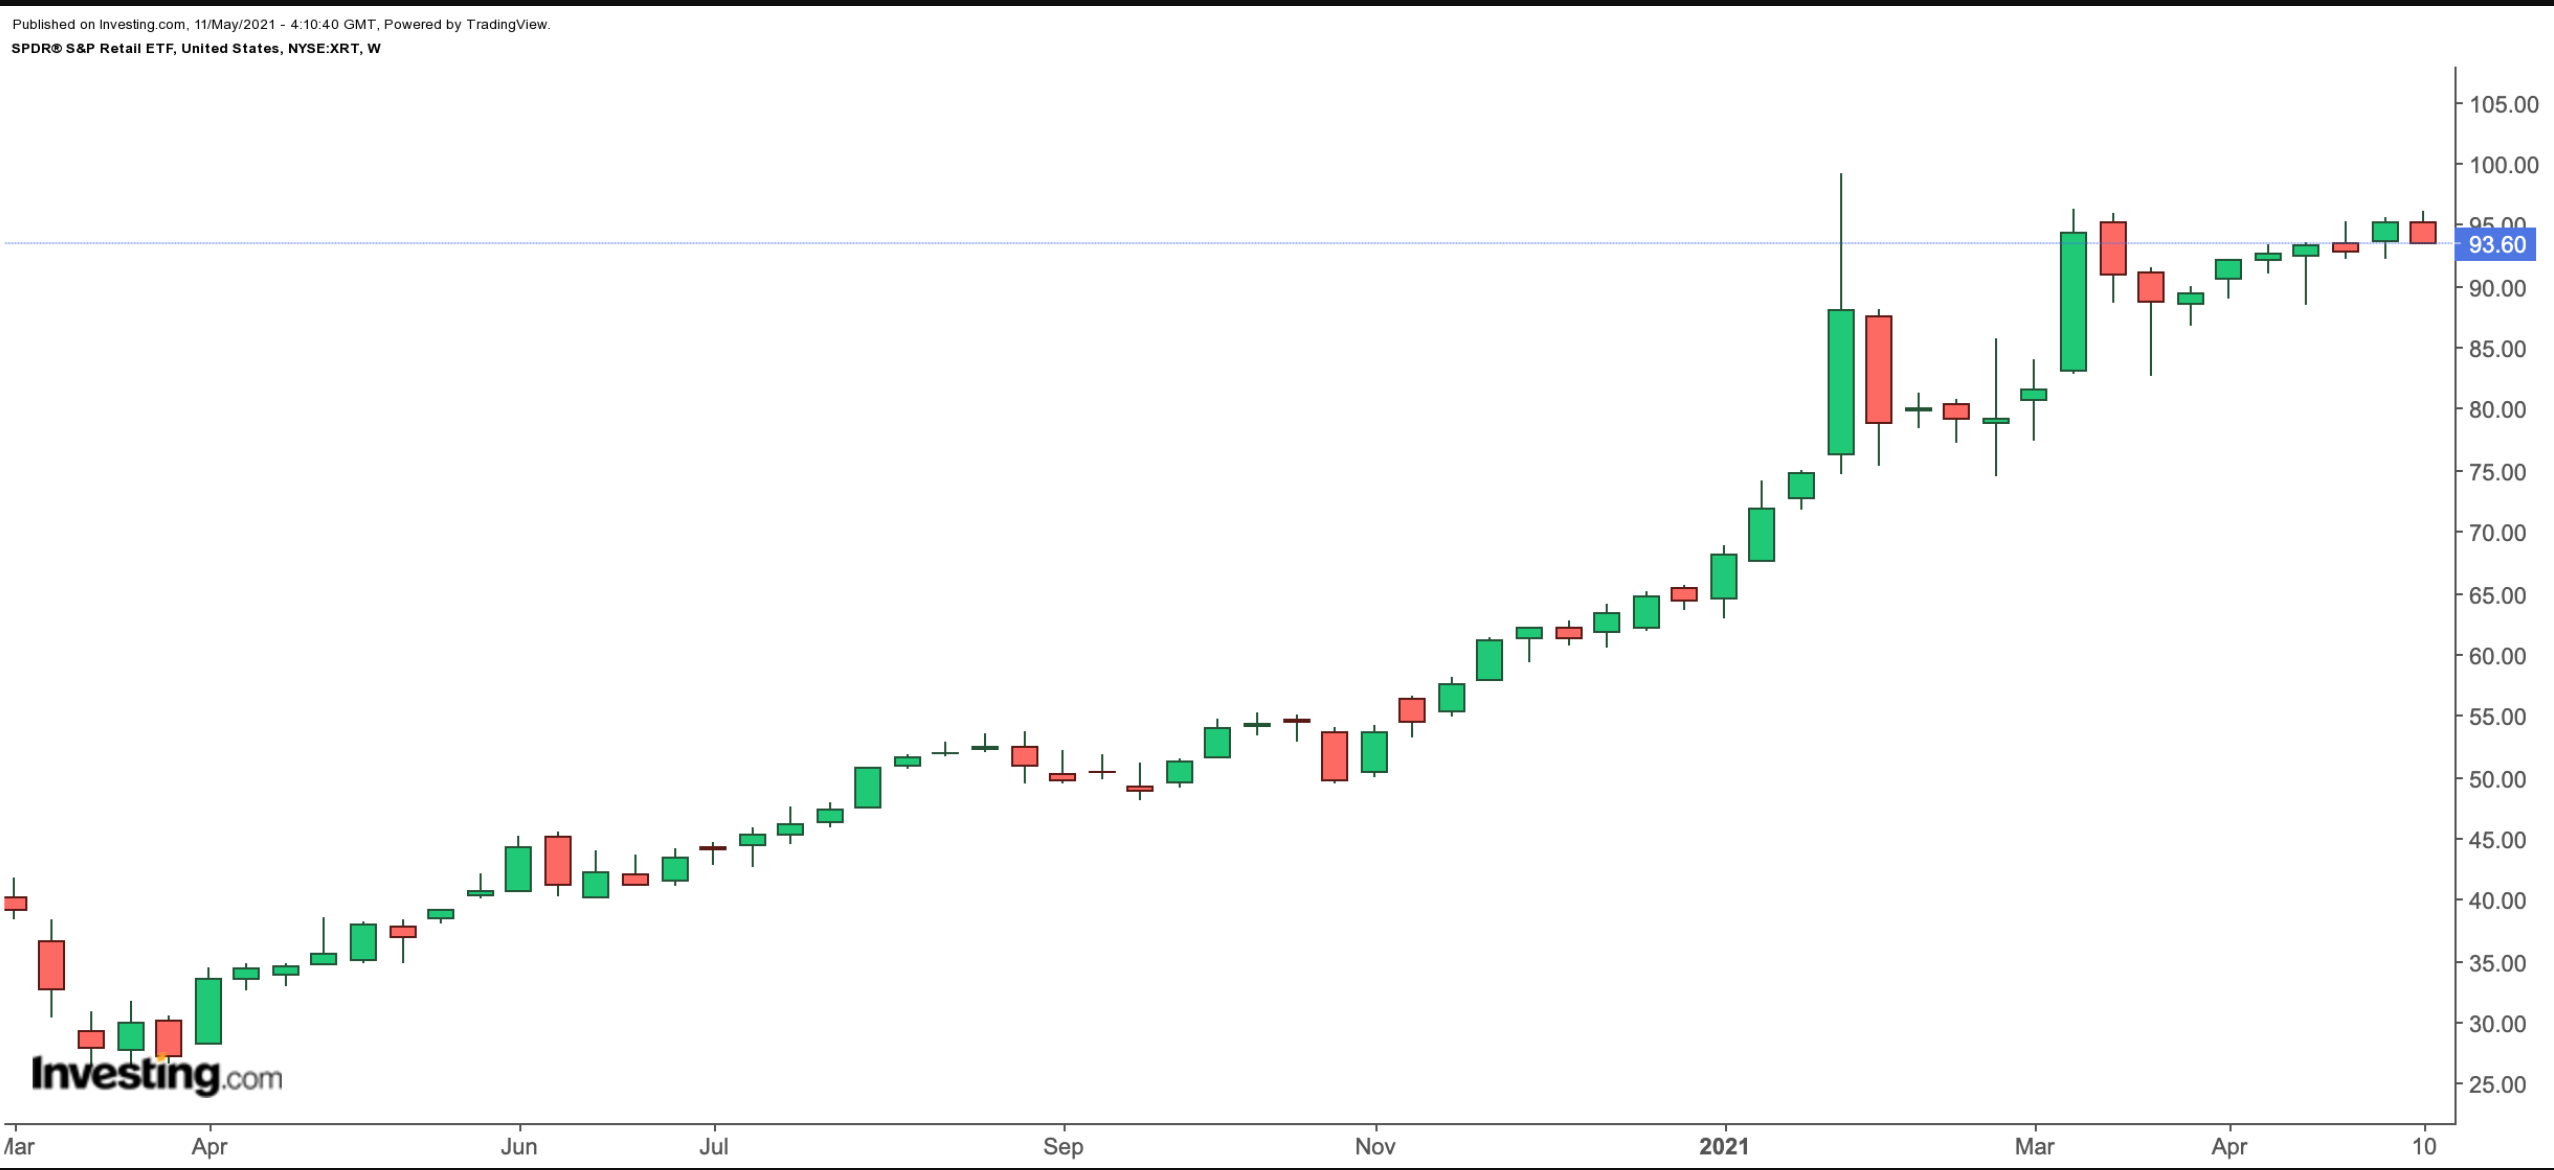
- Current Price: $93.60
- 52-Week Range: $34.70 - $99.24
- Dividend Yield: 1.11%
- Expense Ratio: 0.35% per year
The SPDR® S&P Retail ETF (NYSE:XRT) could appeal to investors interested in US-based retail businesses. Since its inception in June 2006, net assets have grown to $1.03 billion.

XRT, which tracks the returns of the S&P Retail Select Industry Index, currently has 1,001 stocks. The top 10 holdings comprise close to 13% of assets. In terms of sub-sectoral allocation, apparel retail (19.53%) has the largest weighting, with 20.11%. Next in line are internet and direct marketing retail (19.14%), automotive retail (18.54%), specialty stores (16.42%) and food retail (6.38%).
Among the leading firms are the sporting goods and outdoor recreation retailer Academy Sports Outdoors (NASDAQ:ASO), footwear retailer Designer Brands (NYSE:DBI), multi-brand specialty retailer American Eagle Outfitters (NYSE:AEO), automotive parts retailer AutoZone (NYSE:AZO) and athletic specialty store operator Hibbett Sports (NASDAQ:HIBB).
Year-to-date, XRT has climbed by 49% and saw an all-time high on Jan. 28. Since then, the fund is down close to 5%. Trailing P/E and P/B ratios stand at 19.16 and 4.06, respectively. We like the diversity of the fund and would consider investing around $90.
