Commodities are hot. So hot analysts are debating whether a multi-year supercycle for commodities is here.
After a challenging start to 2020, especially in the early days of the pandemic, commodities have increasingly benefitted from the expectation of economic recovery in recent months.
A global rebound in manufacturing, led by China and the US, is providing momentum for commodity prices. Meanwhile, the upcoming infrastructure investments proposed by US President Joseph Biden will likely add further tailwinds to commodities. Recent research by Rabobank points out:
"Agricultural commodity prices have surged almost 50% since mid-2020, causing concerns over food price inflation around the world."
Seasoned investors would concur that commodity prices have historically risen in tandem with inflation. Many individuals allocate a portion of their portfolios to commodities as a hedge against inflation. Furthermore, the transition to green energy is increasing our reliance on commodities.
For instance, the Copper Development Association (CDA) highlights:
"Copper is a major component in EVs used in electric motors, batteries, inverters, wiring and in charging stations. A pure electric vehicle can contain more than a mile of copper wiring in its stator windings…. In 2016, the estimated amount of copper used in all electric vehicles was nearly 26 million pounds. The increasing demand will significantly impact the copper market. The demand for copper due to electric vehicles is expected to increase by 1,700 kilotons by 2027."
On a final note, increasing commodity prices have also brought positive earnings momentum to many businesses operating in commodities industries. Increased cash flows and improving balance sheets are, in turn, leading to further improvement in these firms’ operational and financial performances.
Therefore, today we introduce two exchange-traded products (ETPs) that could appeal to a wide range of commodity bulls.
1. iPath Bloomberg Commodity Index Total Return ETN
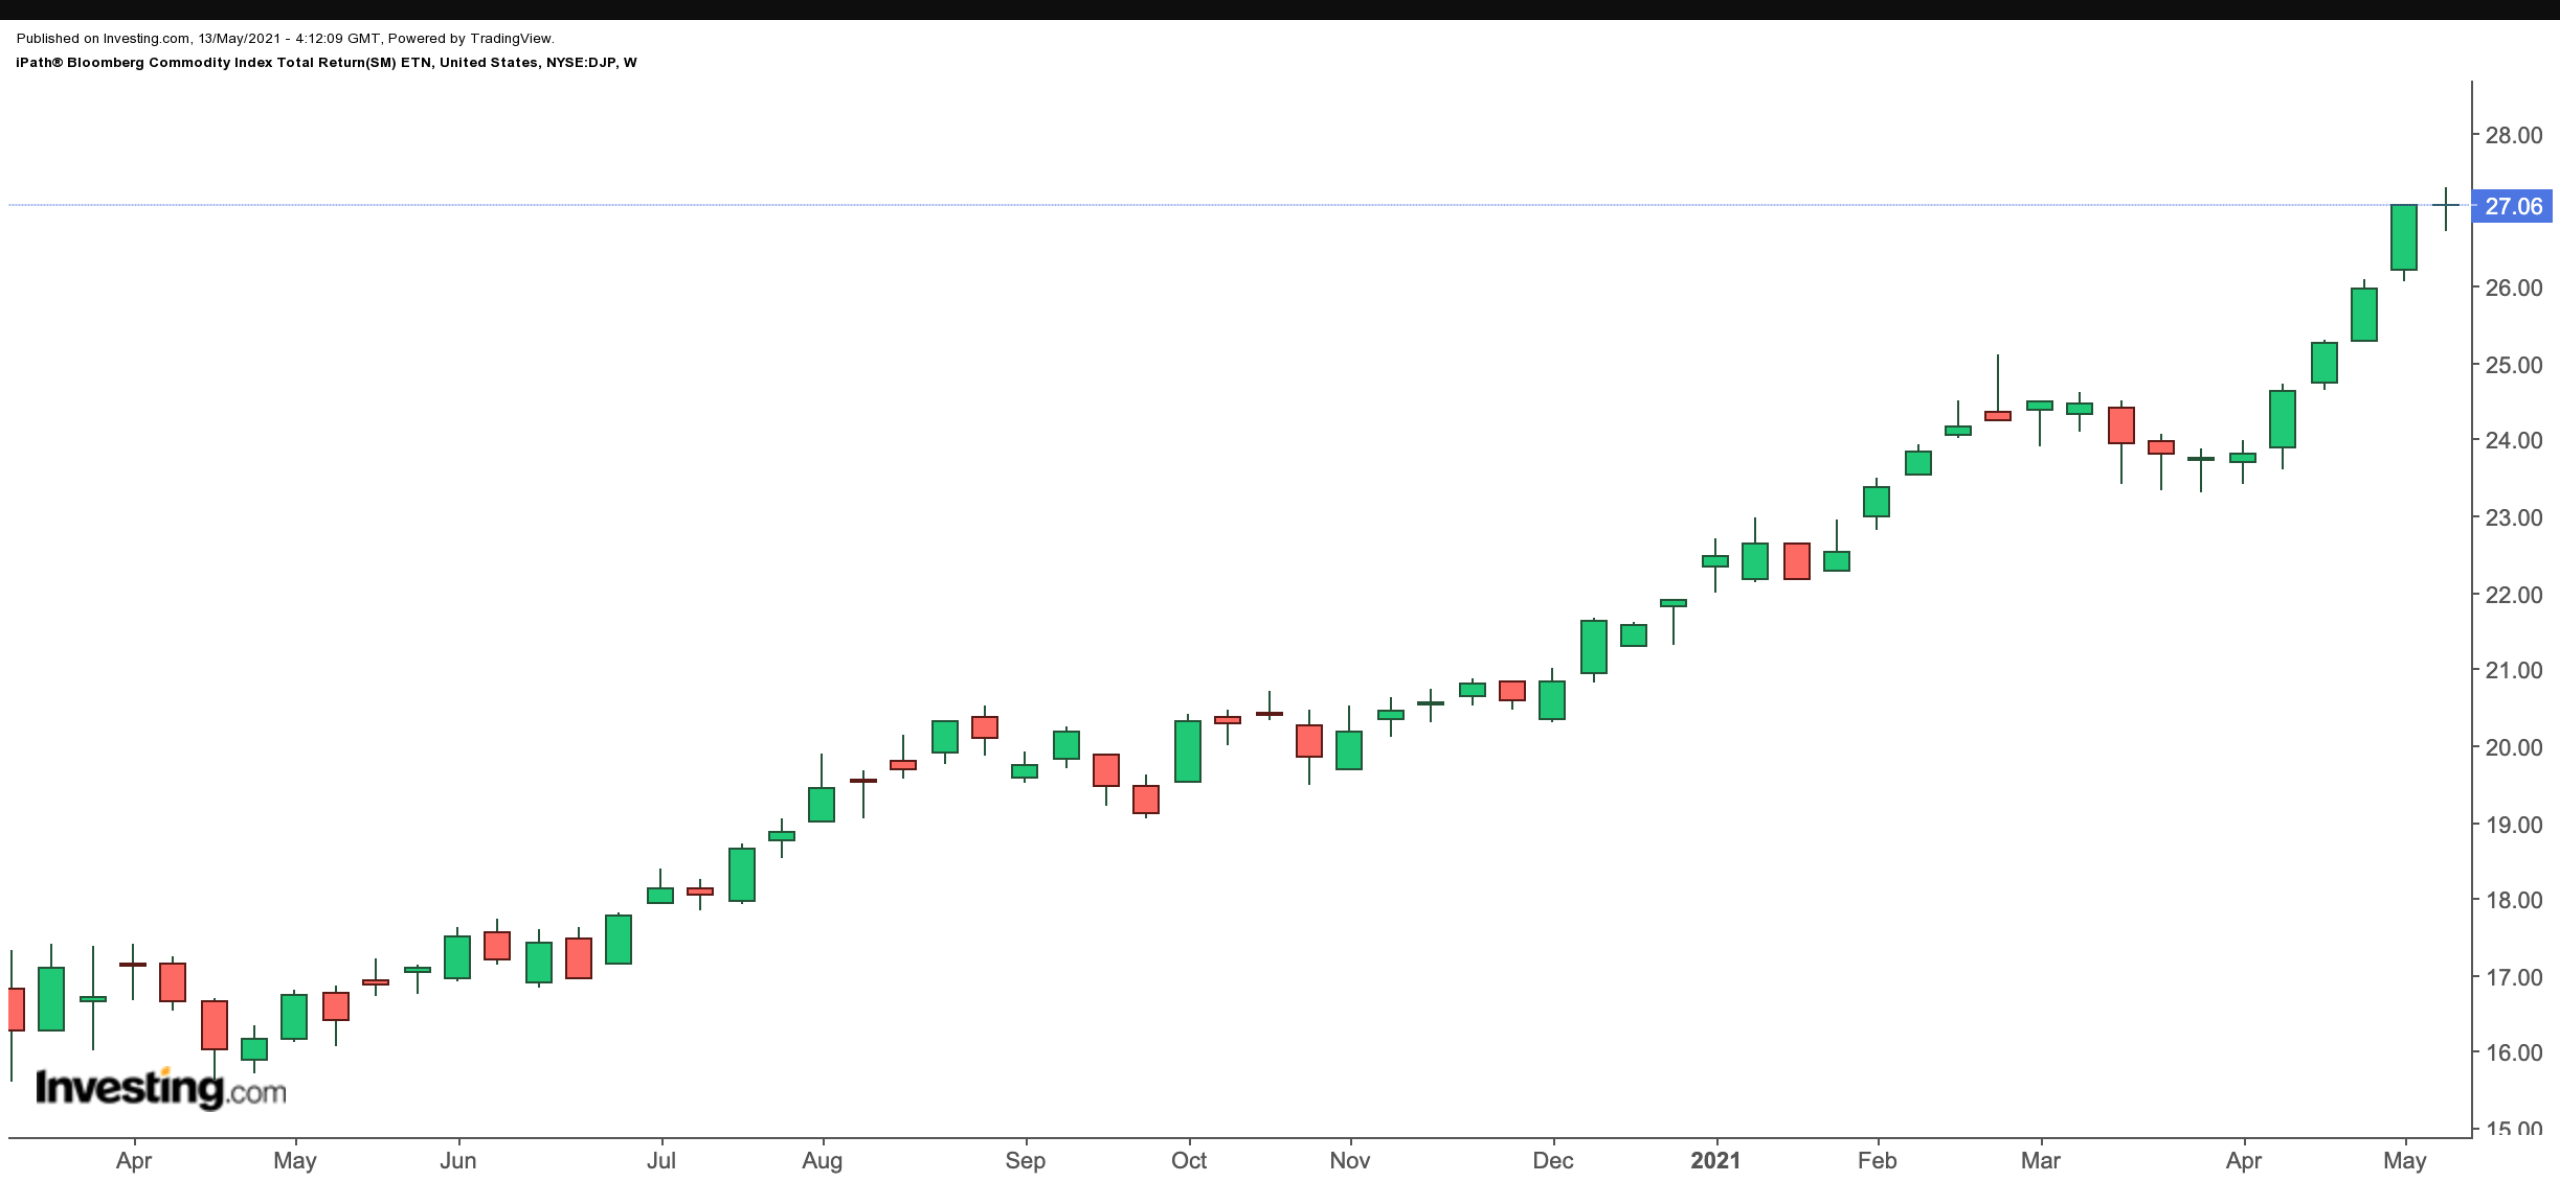
Current Price: $27.06
52-Week Range: $16.07 - $27.25
Expense: 0.70% per year
This is an exchange-traded note (ETN), or an unsecured debt security issued by a financial institution, usually a bank. An ETN's value is backed by the credit rating of the underwriting issuer. Thus, its price could decline if the credit of the underwriter were to go down.
An investor could feel confident that issuers like Barclays (NYSE:BCS), Morgan Stanley (NYSE:MS) or UBS (NYSE:UBS) would always repay these notes. However, default risks always exist, as the collapse of Lehman Brothers showed in 2008. At the time, ETN investors were left with unsecured claims during the bankruptcy proceedings.
Like stocks and ETFs, ETNs also trade on major exchanges. However, unlike ETFs, ETNs are not registered investment companies. Thus, investors do not own a share of the underlying portfolio of assets in the fund. Instead, they hold a bond-like certificate indicating the debt of the underwriter (such as the bank) to the holder of the ETN.
Returns to an investor generally come from trading the ETN. Daily market prices of ETNs fluctuate like stocks or ETFs.
The iPath® Bloomberg Commodity Index Total Return (SM) ETN (NYSE:DJP) is issued by Barclays Bank and gives exposure to the Bloomberg Commodity Total Return Index.

DJP’s current sector weightings are: energy (54.09%), grains and oilseeds (16.38%), industrial metals (12.34%), livestock (7.79%), precious metals (5.50%) and softs (3.90%). The top component of the index is WTI crude oil (22.47%), followed by Brent crude (16.03%), corn (6.86%), copper (5.72%) and gold (4.90%),
So far in 2021, the ETN is up about 24%, hovering at multi-year highs. In the case of short-term profit-taking, potential investors could consider buying around $25. The global supply-demand conditions are likely to support the prices of many commodities in the coming quarters, too.
2. iShares GSCI Commodity Dynamic Roll Strategy ETF
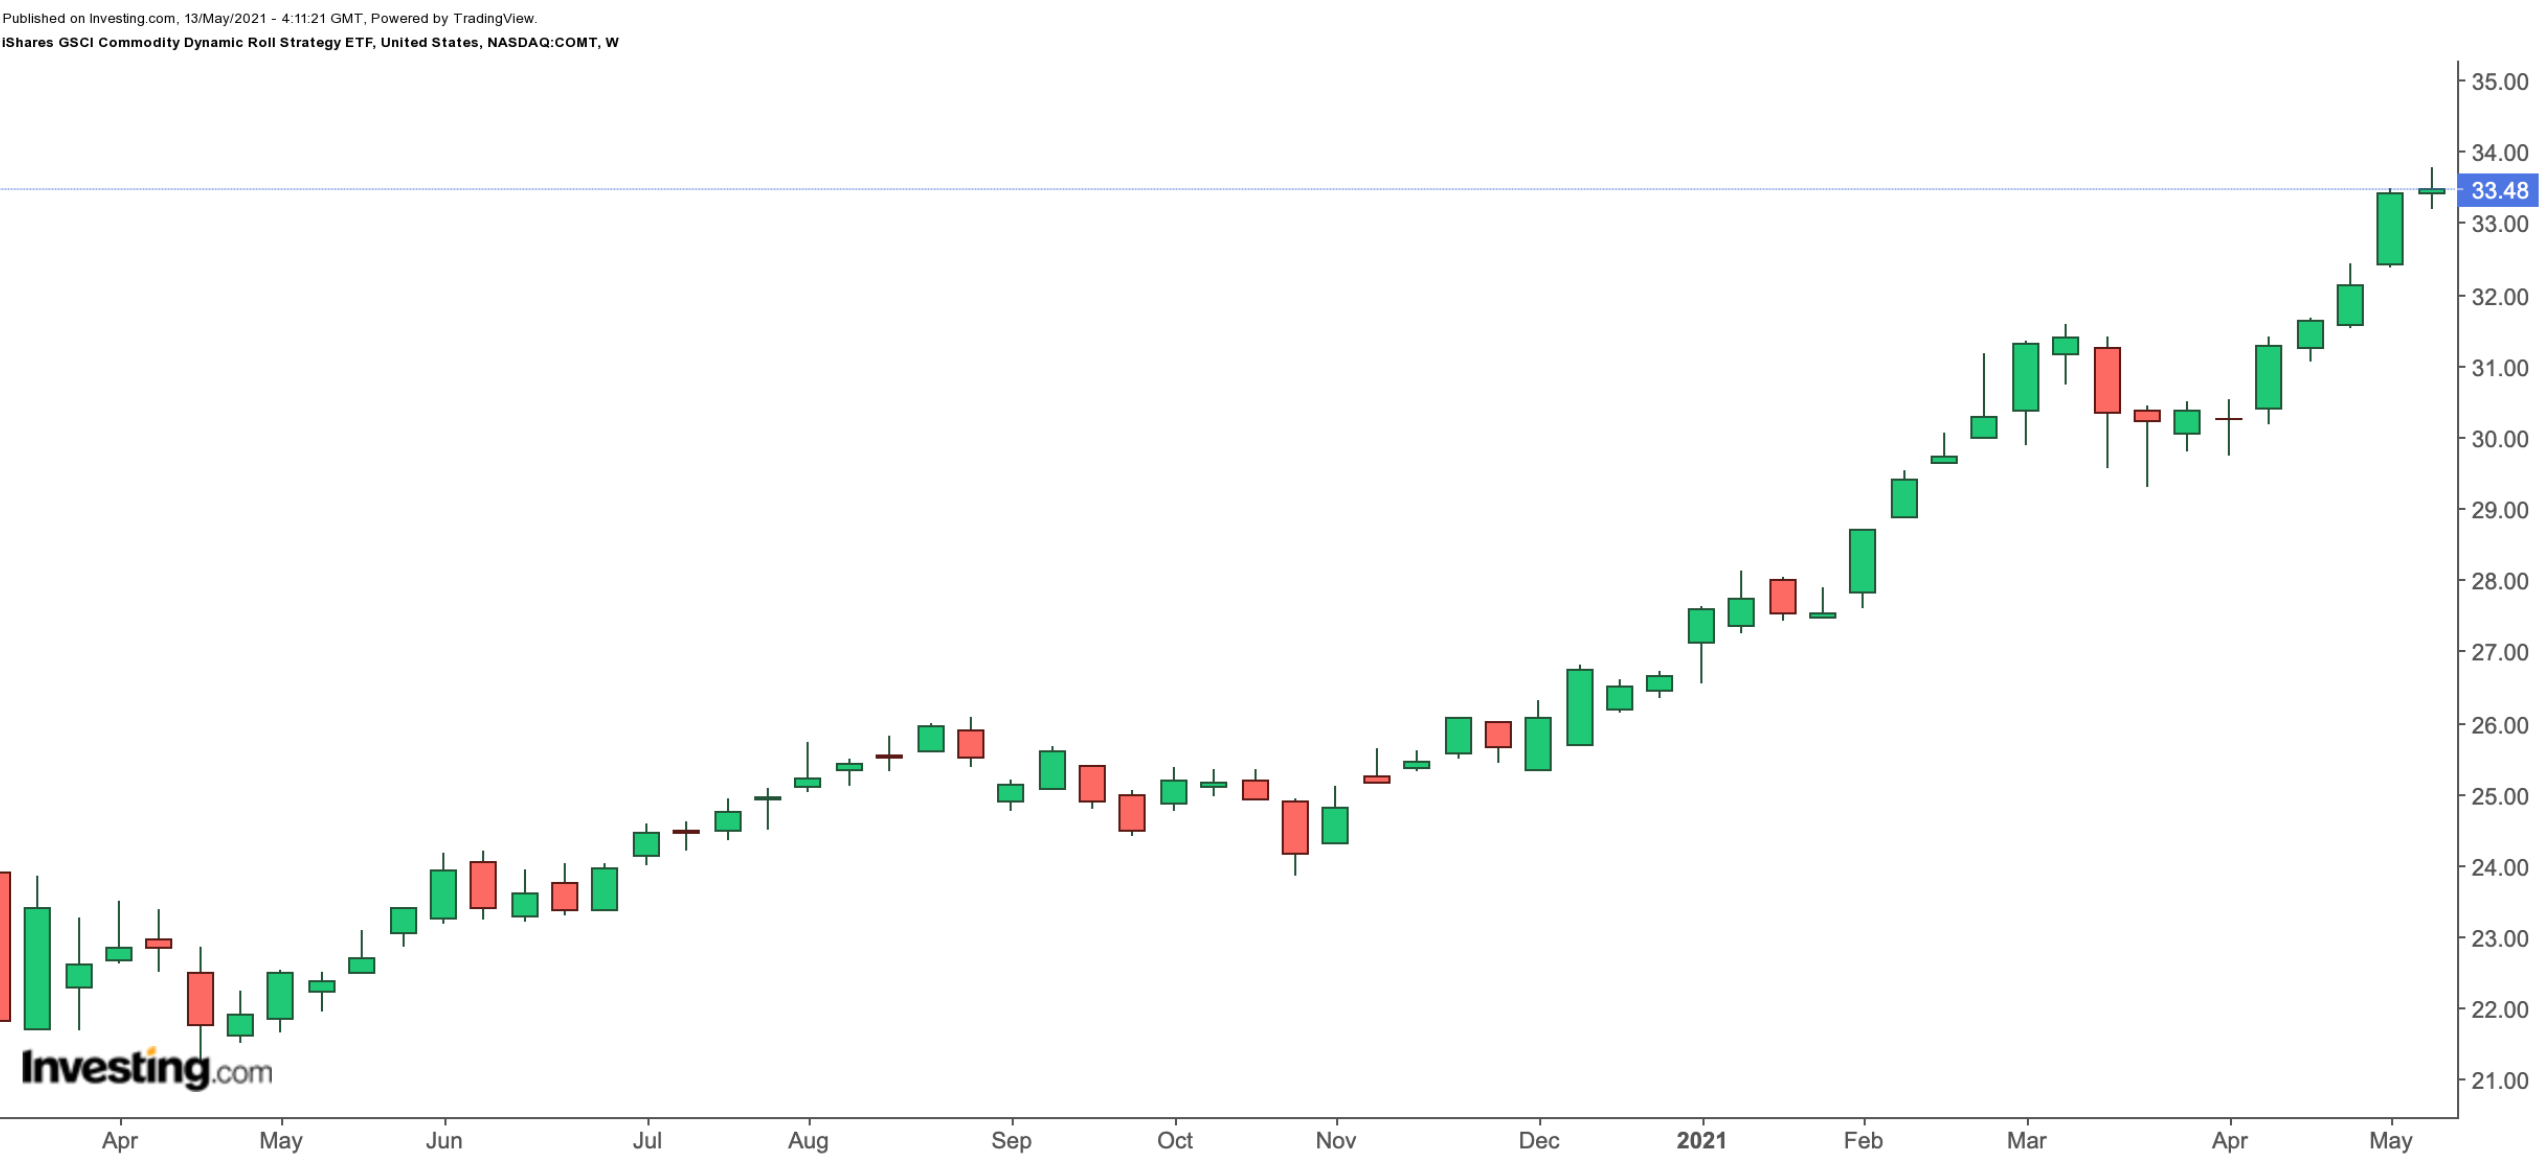
Current Price: $33.48
52-Week Range: $21.95 - $33.62
Dividend Yield: 0.29%
Expense Ratio: 0.48% per year
The iShares GSCI Commodity Dynamic Roll Strategy ETF (NASDAQ:COMT) gives exposure to a wide range of commodities. It is an actively managed ETF. In addition to futures contracts on commodities, it also invests in individual stocks—hence, the dividend yield.

The fund started trading in October 2014 and assets under management stand at $763.4 million. COMT’s current sector weightings are: energy (53.60%), agriculture (21.01%), industrial metals (13.13%), livestock (6.78%) and precious metals (5.49%).
Year-to-date, the fund is up more than 25% and recently hit a multi-year high. We like the diversification the fund offers with its holding future contracts and cash positions in shares. A potential decline toward the $30 level would improve the margin of safety.
