No question about it, March was painful, very painful, for stocks. And going into April the market continues to remain vulnerable and volatile.
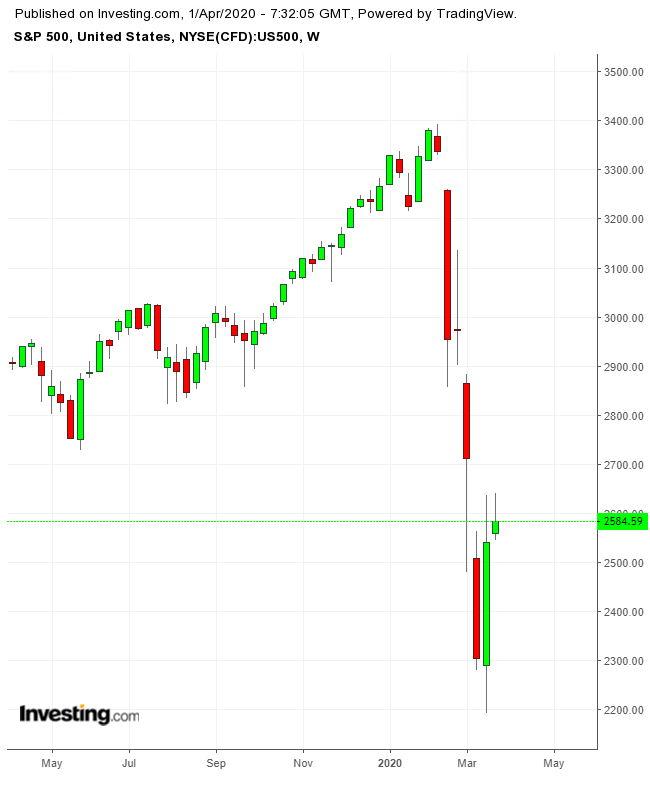
Just look at the last three days: the S&P 500 fell 3.4% on Friday, gained 3.4% on Monday and dropped 1.8% on Tuesday—all of this after a three-day rally that pushed the index up 17.6%.
Worst Q1 For Stocks Since 2008
For all that, the first quarter was the worst for stocks overall since the fourth quarter of 2008.

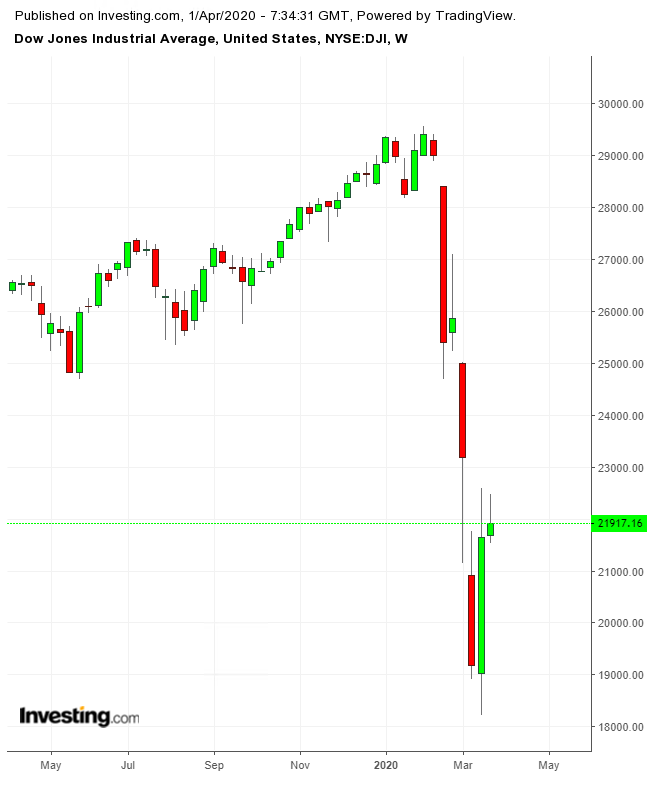
The 23.2% quarterly slump for the Dow Jones Industrial Average was slightly more than the 22.7% loss it absorbed in the 2008 quarter and was its worst first quarter showing ever.
In all, the S&P 500 fell 12.5% in March and 20% for the first quarter. The Dow dropped 13.7% for the month to go with that horrific quarterly loss. The NASDAQ Composite's loss was 10.1% for March and 14.3% for the quarter.
Save for the big rebound that started mid-morning on March 23, the stock market's performance could have been much worse.

At its lows, the S&P 500 was down more than 32% from its mid-February top. The Dow had fallen 38.5%, and the NASDAQ Composite was off 32.6%. A week later, the losses from the market highs had been trimmed to 23.8% with the Dow's loss cut to 25.9% and the NASDAQ's drubbing improving to ONLY 21.7%.
Just about everything fell in March. Restaurants, airline and hotel bookings and non-essential retail sales collapsed.
West Texas Intermediate crude (WTI) dropped 54.2%—66.5% for the quarter. Copper, a closely watched indicator of future economic activity, dropped more than 12.2% in March and 20% for the quarter.

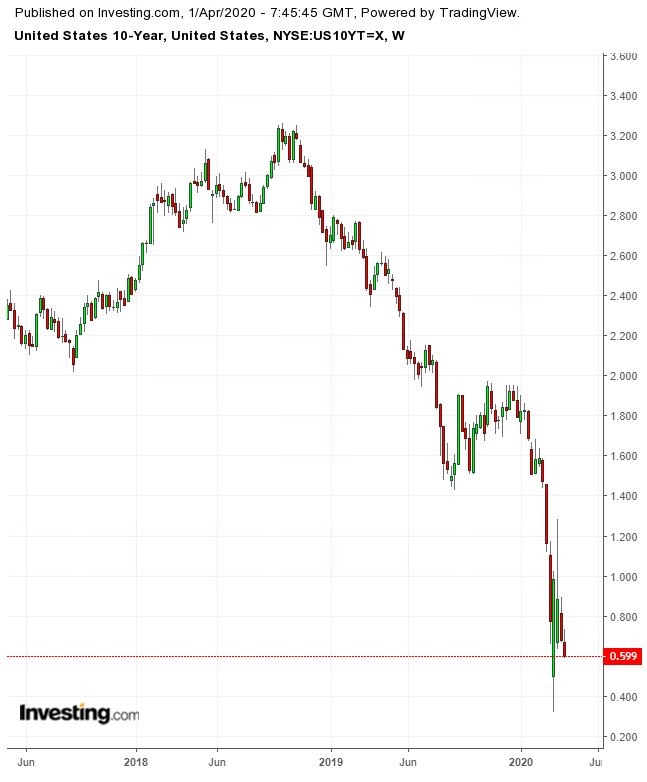
The 10-year Treasury yield fell 42.6% to 0.668% in March, bringing its quarterly decline to 65.2%. In comparison, at Donald Trump's inauguration on Jan. 20, 2017, the benchmark's yield was 2.498%.
As for the U.S. market for initial public offerings—it simply ceased.
Recovery? Unclear; And Don't Expect A Smooth Ride Higher
What's ahead is not yet clear. Yes, the Federal Reserve and central banks around the world have pledged to do whatever it takes to keep economies going. Yes, Congress passed, and President Trump signed, a $2 trillion rescue package for the U.S. economy. (And there may be yet more federal aid.)
It may also be true that once the worst of the COVID-19 pandemic has passed, credit and debit cards will be flashed with wild abandon. But there's no guarantee.
As well, for the above to happen investors and markets need to get beyond three big unknowns:
• When will the worst of the pandemic pass?
• When that happens, will consumers—from governments to regular retail customers—start spending confidently? Economic recoveries often start tentatively and gain momentum over time.
• How much not-yet-visible damage from the March 2020 market panic has been done to companies, to markets and to economies?
Markets will begin to get an idea regarding the depth of the economic damage in the United States on Friday when the Labor Department reports on Nonfarm Payrolls and unemployment for March. A much more accurate picture, however, won't come until its April jobs report, due May 1, because the surveys used to build the reports are taken in mid-month.
Nonetheless, states with heavy exposure to the energy industry will already be struggling because many oil and gas producers face significant pressures. The U.S. oil-and-gas rig count is off about 28% from a year ago and 64% from a peak in October 2011, according to Baker Hughes data.
The commodity's slump was more than just a reaction to the COVID-19 virus. Important contributing factors were the collapse of oil prices as Saudi Arabia and Russia battle for dominance in market share and pricing matters and a stock market that was overbought as the year began.
Lastly, bond markets in particular were roiled when investors were hit with margin calls from brokers. That's forced the Federal Reserve to take extraordinary action to help those markets function.
Equally significant, the slump came with frightening speed. The 35% decline that rocked the S&P 500 started after the index hit an all-time high on Feb. 19 and found a bottom on March 23. The five-week decline was slightly faster than what hit markets in the fall of 1987. And it took roughly 17 months for the index to bottom after its peak in October 2007.
Plus, when the market recovery comes, don't expect a smooth ride higher. Stocks will probably first test their lows reached on March 23 before a real recovery can set in. Whether you’re talking stocks, bonds or indices, a clear signal of a bottom that holds is important.
Lots Of Losers, Few Winners
In the meantime, there are just so many losses to dig through, with travel companies—including airlines, cruise lines, hotels and booking companies—energy companies and retailers suffering the biggest losses for the month and quarter.

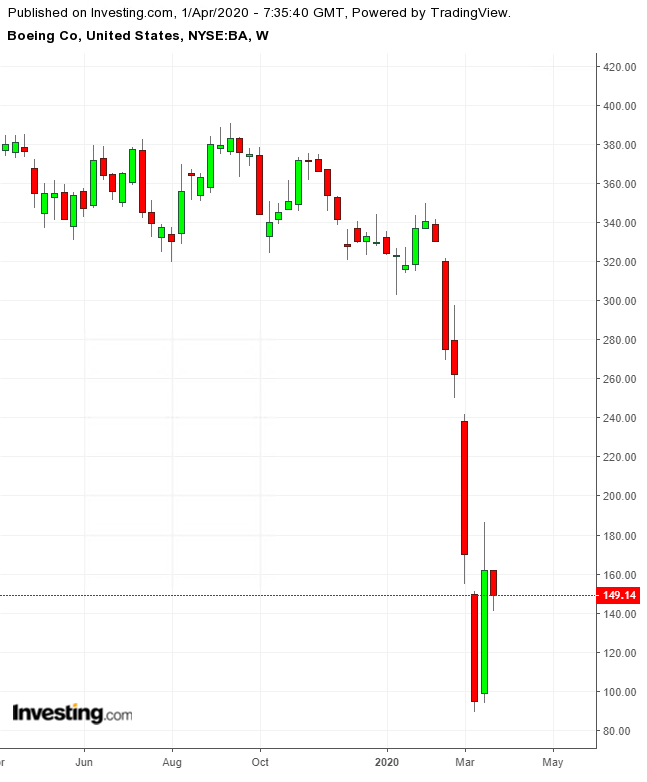
Boeing (NYSE:BA), for example, is down from 66.3% from its March 2019 peak. It fell 45% in March and 54% for the quarter, battered by its 737 MAX woes as well as pandemic issues.
United Airlines Holdings (NASDAQ:UAL) was off nearly 49% for the month and about 54% during the quarter.
Exxon Mobil (NYSE:XOM) is down 55% from its 52-week high. Apache (NYSE:APA), long a respected oil-and-gas producer, fell 83% in a month.
Macy's (NYSE:M), which just announced it is furloughing nearly all its employees, is down 81% from its 52-week high, 63% for March and 71% for the year.
There weren't many winners for March or the quarter. Only three Dow stocks were higher in March—Wal-Mart (NYSE:WMT), Walgreens Boots Alliance (NASDAQ:WBA) and Merck (NYSE:MRK). Microsoft (NASDAQ:MSFT) was the only Dow stock showing a gain for the quarter, but it was up a miniscule 0.01%.
Among S&P 500 stocks, only 27 were ahead on the month, 28 for the quarter; on the NASDAQ 100, 13 were up for the month, 15 for the quarter.
Citrix Systems (NASDAQ:CTXS), which makes collaborative software, Regeneron Pharmaceuticals (NASDAQ:REGN) and Netflix (NASDAQ:NFLX) were among the top S&P 500 performers. They were also among the leading performers on the NASDAQ 100.
