- The P/E ratio is a crucial metric for investors, providing insight into how much they're willing to pay for each dollar of a company's earnings.
- Currently, the S&P 500 is trading at more than 20 times its anticipated earnings, exceeding its 5-year and 10-year averages, raising concerns about overvaluation.
- In this piece, we will analyze overvalued stocks that are trading at over 70 times their 12-month expected earnings.
- If you invest in the stock market, get an interesting discount HERE! Find more information at the end of this article.
Investors tend to routinely monitor stock valuations, assessing whether they are expensive or reasonably priced.
To do so, they employ various ratios and metrics. Among the most favorable is the Price/Earnings Ratio (P/E ratio).
The P/E ratio is derived by dividing the share price by the earnings per share, which can be either historical or anticipated in the future.
This ratio provides insight into the amount an investor is willing to pay for each dollar of a company's earnings.
Essentially, it quantifies the number of years needed to recoup the investment in shares through the company's profits.
The P/E ratio can be categorized as follows:
- Between 0 and 10: Company shares are considered undervalued.
- Between 10 and 17: This range is deemed ideal.
- Between 17 and 25: Company shares are considered overvalued.
Currently, the S&P 500 is trading at more than 20 times its anticipated earnings, surpassing both its 5-year average (18.9) and 10-year average (17.7).
Furthermore, 8 out of the 11 sectors are trading above their 25-year average.
However, our focus today is on stocks that are trading at over 70 times their 12-month expected earnings.
It's crucial to note that a P/E ratio exceeding 20 suggests investors are paying significantly more P/E ratio share than the company is earning.
This could be due to high expectations for future growth and earnings, or it may indicate that the company is significantly overvalued.
So here are the 4 stocks considered overvalued by the market:
1. Digital Realty Trust
Digital Realty Trust (NYSE:DLR) is an Austin-based U.S. company specializing in data center management.
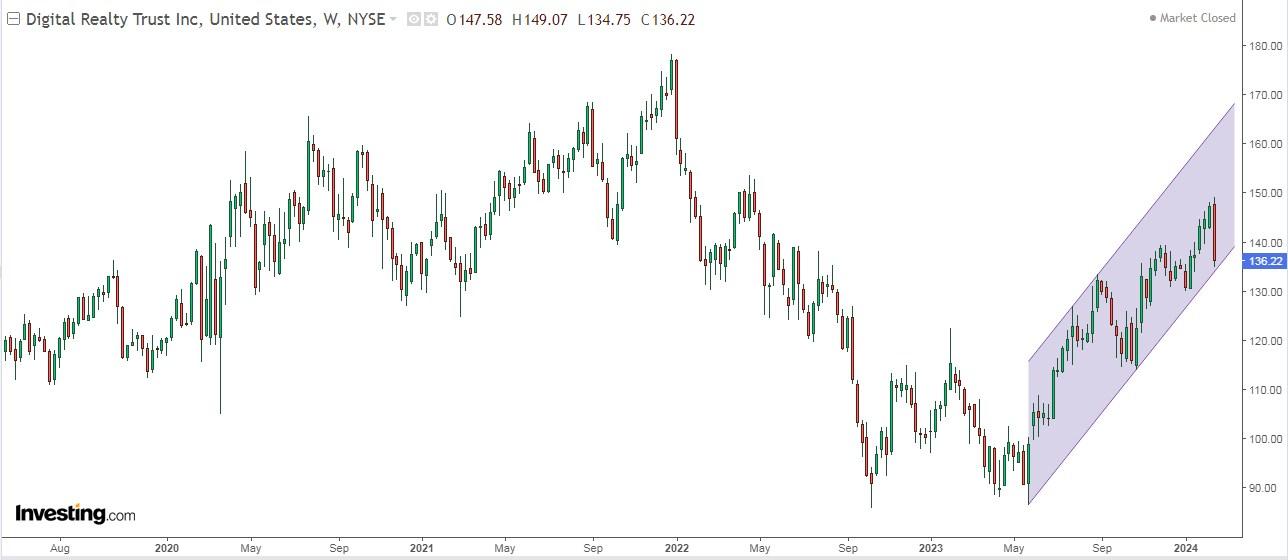
It trades at 135 times its 12-month earnings.
It will present its accounts on April 25. Looking ahead to 2024, EPS (earnings P/E ratio share) is expected to increase by +61.4% and revenue by +2.9%.
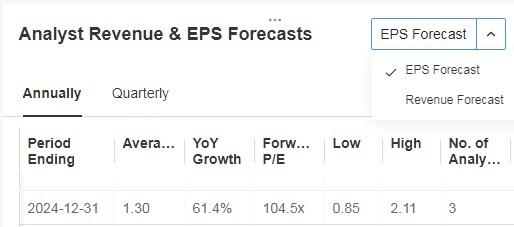
Source: InvestingPro
Its dividend yield is +3.58%.
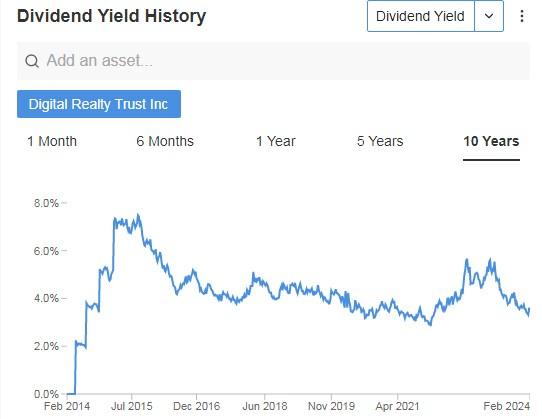
Source: InvestingPro
Its shares are up +31.02% in the last 12 months and +1.18% in the last 3 months.
It trades at 136, 22 and the market already sees very little potential for it, specifically at $140.16.

Source: InvestingPro
2. Illumina
Illumina (NASDAQ:ILMN) is an American company founded in April 1998 and based in San Diego, California, which develops, manufactures, and markets systems for the analysis of genetic variation and biological function.
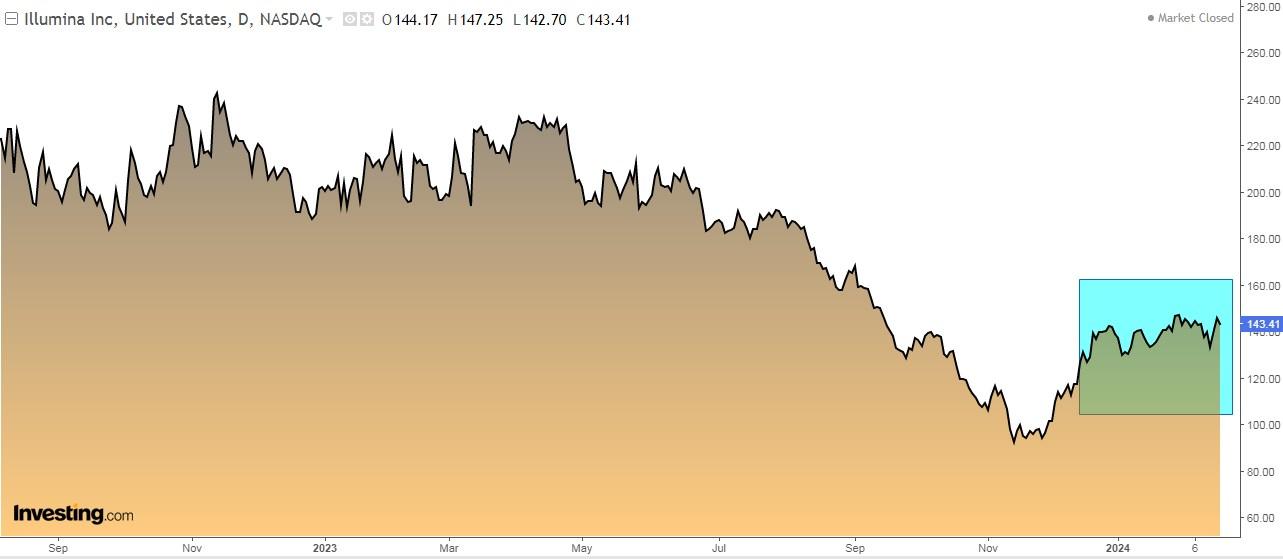
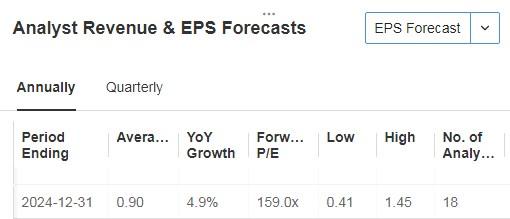
It trades at 125 times its 12-month earnings.
It will report its numbers on April 23. Looking ahead to 2024, EPS (earnings P/E ratio share) is expected to increase +4.9% and revenue +0.7%.
Source: InvestingPro
Its shares are down -29.30% in the last 12 months and up +46.90% in the last 3 months.
The market still sees some room for it this year, specifically from the current $143.41 to $157.78.

Source: InvestingPro
3. Insulet
Insulet (NASDAQ:PODD) is a company that develops, manufactures, and sells insulin delivery systems for people with diabetes. It was incorporated in 2000 and is based in Acton, Massachusetts.
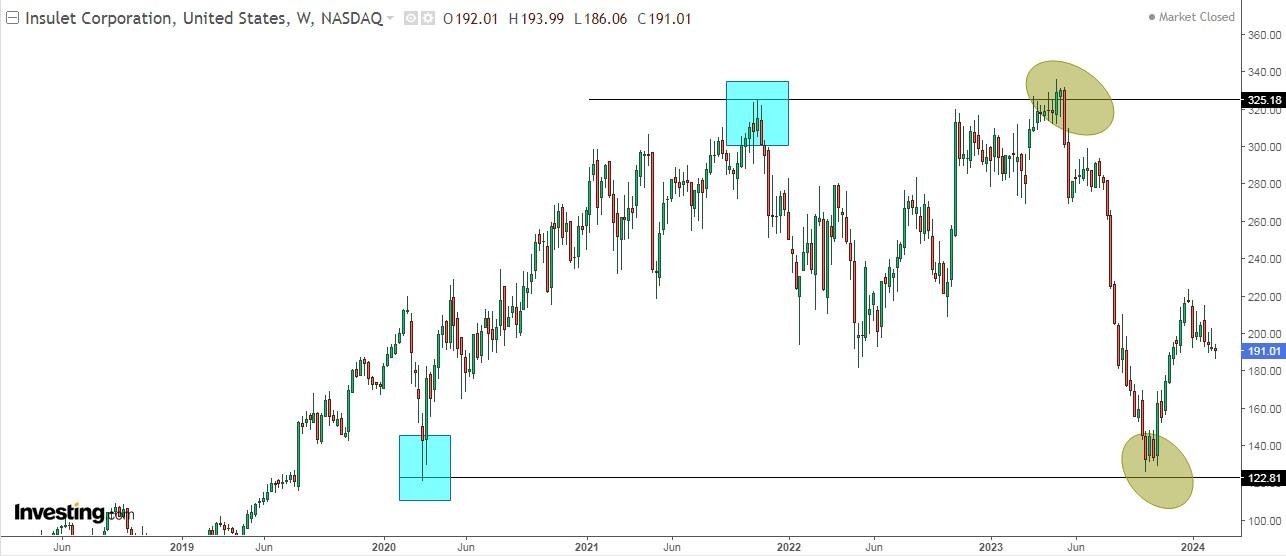
It trades at 85 times its 12-month earnings.
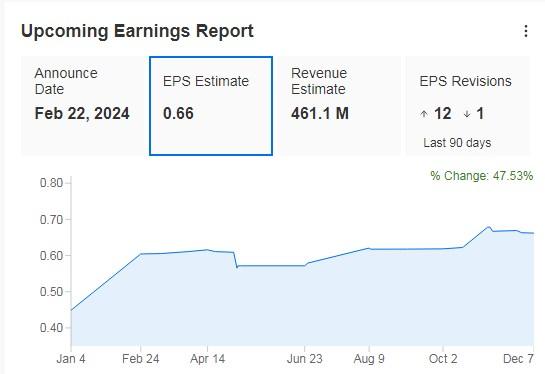
On February 22 it presents its earnings report with expectations of +47.53% EPS growth. Looking ahead to 2024, EPS (earnings P/E ratio share) is expected to increase by +26.7% and revenue by +19.9%.
Source: InvestingPro
It has 22 ratings, of which 18 are buy, 4 are hold and none are sell.
Its shares are down -34.63% in the last 12 months and up +5.38% in the last 3 months.
It trades at $191.01 and the market sees interesting potential for it at $234.52.

Source: InvestingPro
4. Dexcom
DexCom (NASDAQ:DXCM) is a company that develops, manufactures, produces, and distributes continuous glucose monitoring systems for diabetes management.
It operates internationally and is headquartered in San Diego, California. It was founded in 1999.
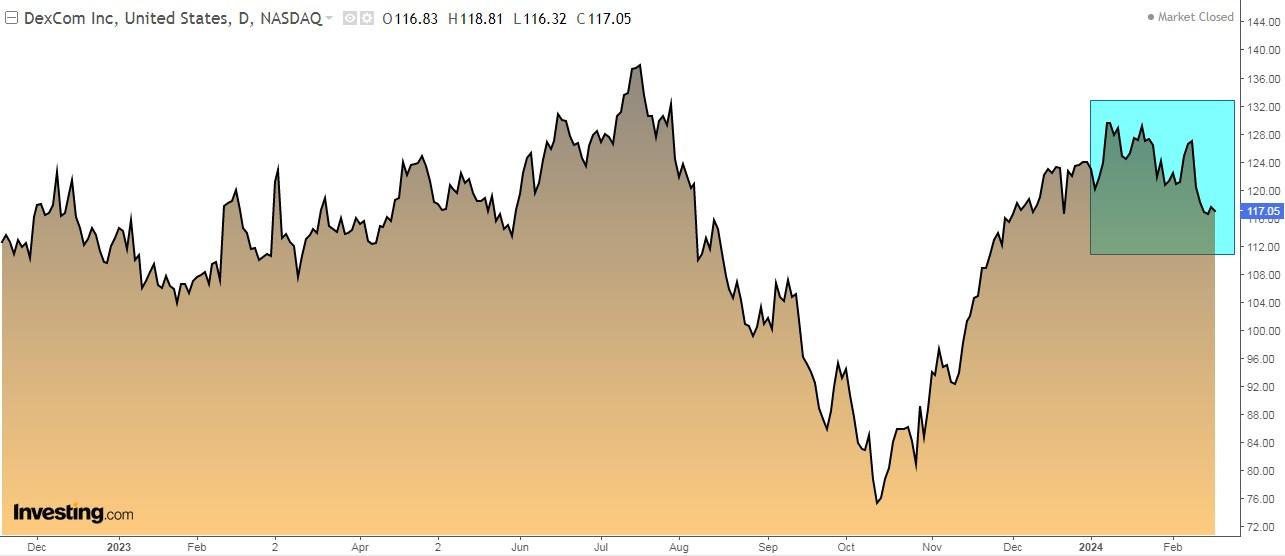
It trades at 73 times its 12-month earnings.
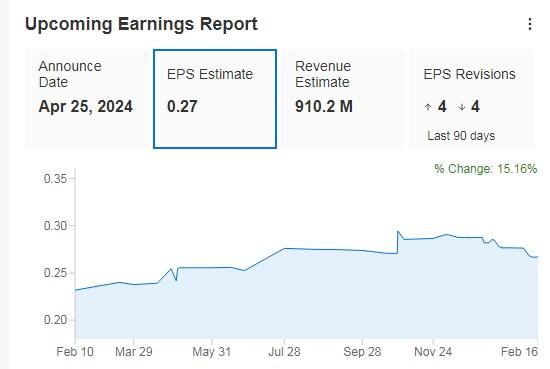
On April 25 it will report its accounts with expectations of an EPS increase of +15.16%. Looking ahead to 2024, EPS (earnings P/E ratio share) is expected to increase by +14.4% and revenue by +19.4%.
Source: InvestingPro
Its shares are up +2.67% in the last 12 months and +7.42% in the last 3 months.
It trades at $117.05 and the market gives it a 12-month potential at $146.39.

Source: InvestingPro
***
Do you invest in the stock market? Set up your most profitable portfolio HERE with InvestingPro!
Apply discount code INVESTINGPRO1 and you'll get an instant 10% discount when you subscribe to the Pro or Pro+ annual or two-year plan. Along with it, you will get:
- ProPicks: AI-managed portfolios of stocks with proven performance.
- ProTips: Digestible information to simplify a lot of complex financial data into a few words.
- Advanced Stock Finder: Search for the best stocks based on your expectations, taking into account hundreds of financial metrics.
- Historical financial data for thousands of stocks: So that fundamental analysis professionals can delve into all the details themselves.
- And many other services we plan to add soon.
Act fast and join the investment revolution - get your offer HERE!
Disclaimer: The author does not own any of these shares. This content, which is prepared for purely educational purposes, cannot be considered as investment advice.

