Growing optimism about the global economy has fueled a spectacular rally in a wide range of raw materials this year, underlining talk of a new commodities super-cycle.
Copper prices jumped to their best level in 10 years, while corn, soybeans, and wheat traded near their highest in eight years. Lumber futures have also soared, notching a series of record closes in recent weeks.
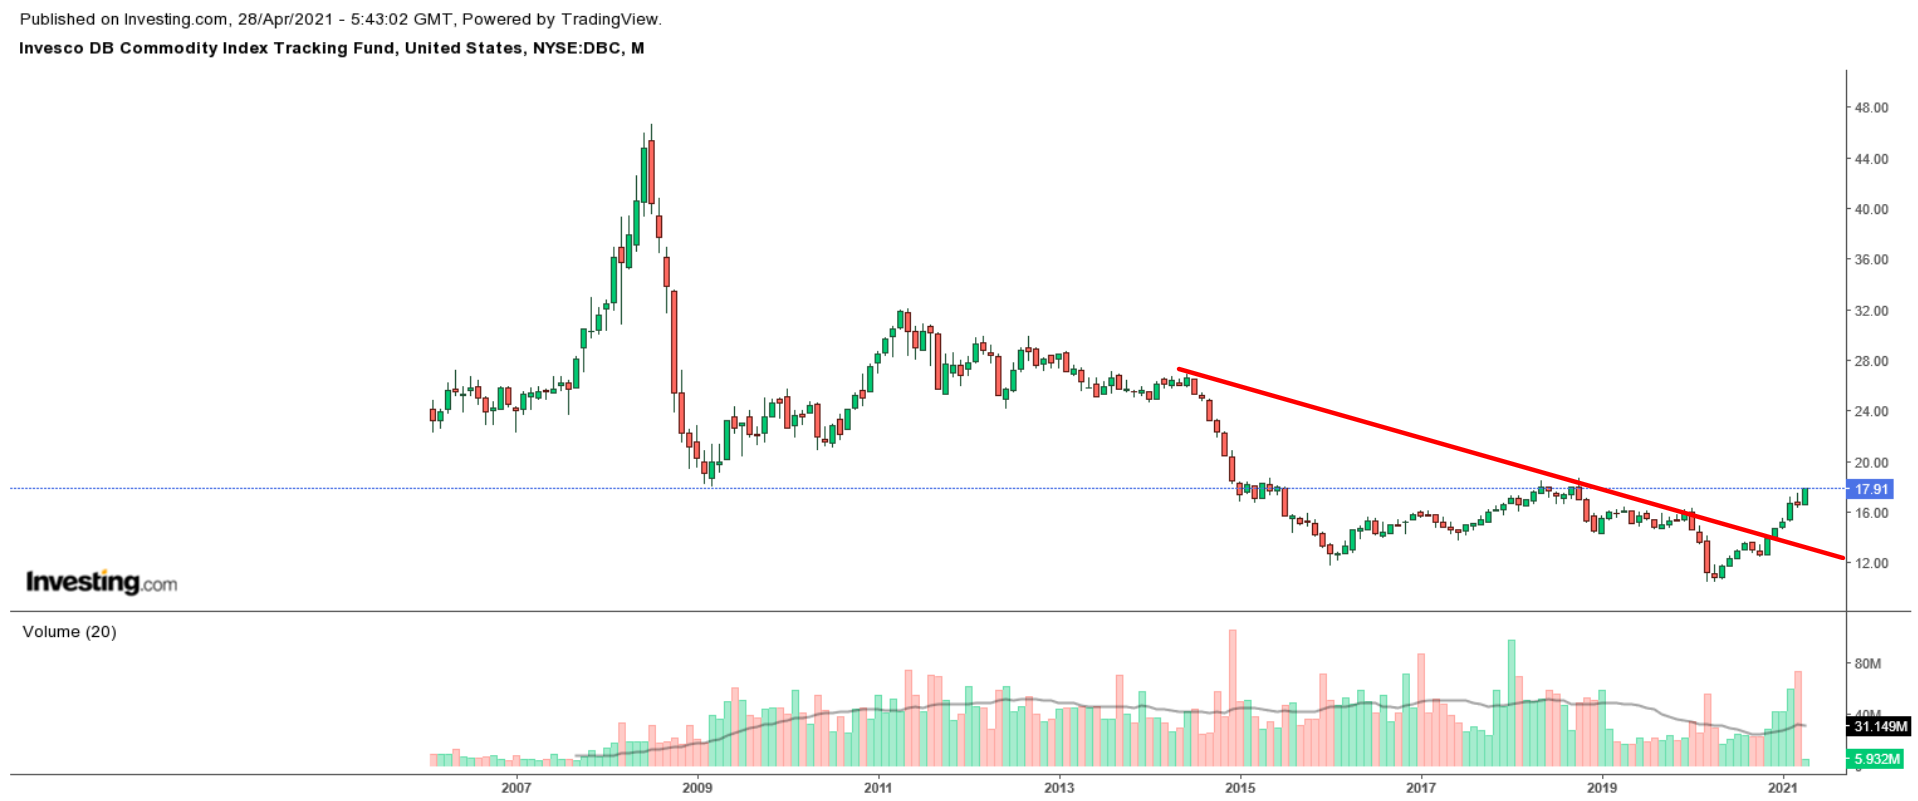
Indeed, the Invesco DB Commodity Index Tracking Fund (NYSE:DBC)—one of the sector’s main ETFs—has gained around 22% year-to-date to reach its best level since October 2018. In comparison, the S&P 500 is up 11.5% over the same timeframe.
Below we highlight three leading names in the sector. Each is well worth considering given the resurgence in global commodity prices.
1. Freeport-McMoran
- Year-To-Date Performance: +48.7%
- Market Cap: $53.6 Billion
Freeport-McMoran (NYSE:FCX), formerly known as Freeport-McMoRan Copper & Gold, is one of the world's largest publicly traded miners. The company, which operates in North America, South America, and Indonesia, primarily explores for copper, gold, molybdenum, silver, and other metals.
FCX stock has soared this year, jumping almost 50% so far in 2021, as surging base metal prices boosted investor sentiment on the raw materials producer. Year-over-year, shares of the mining giant have climbed a whopping 337%.
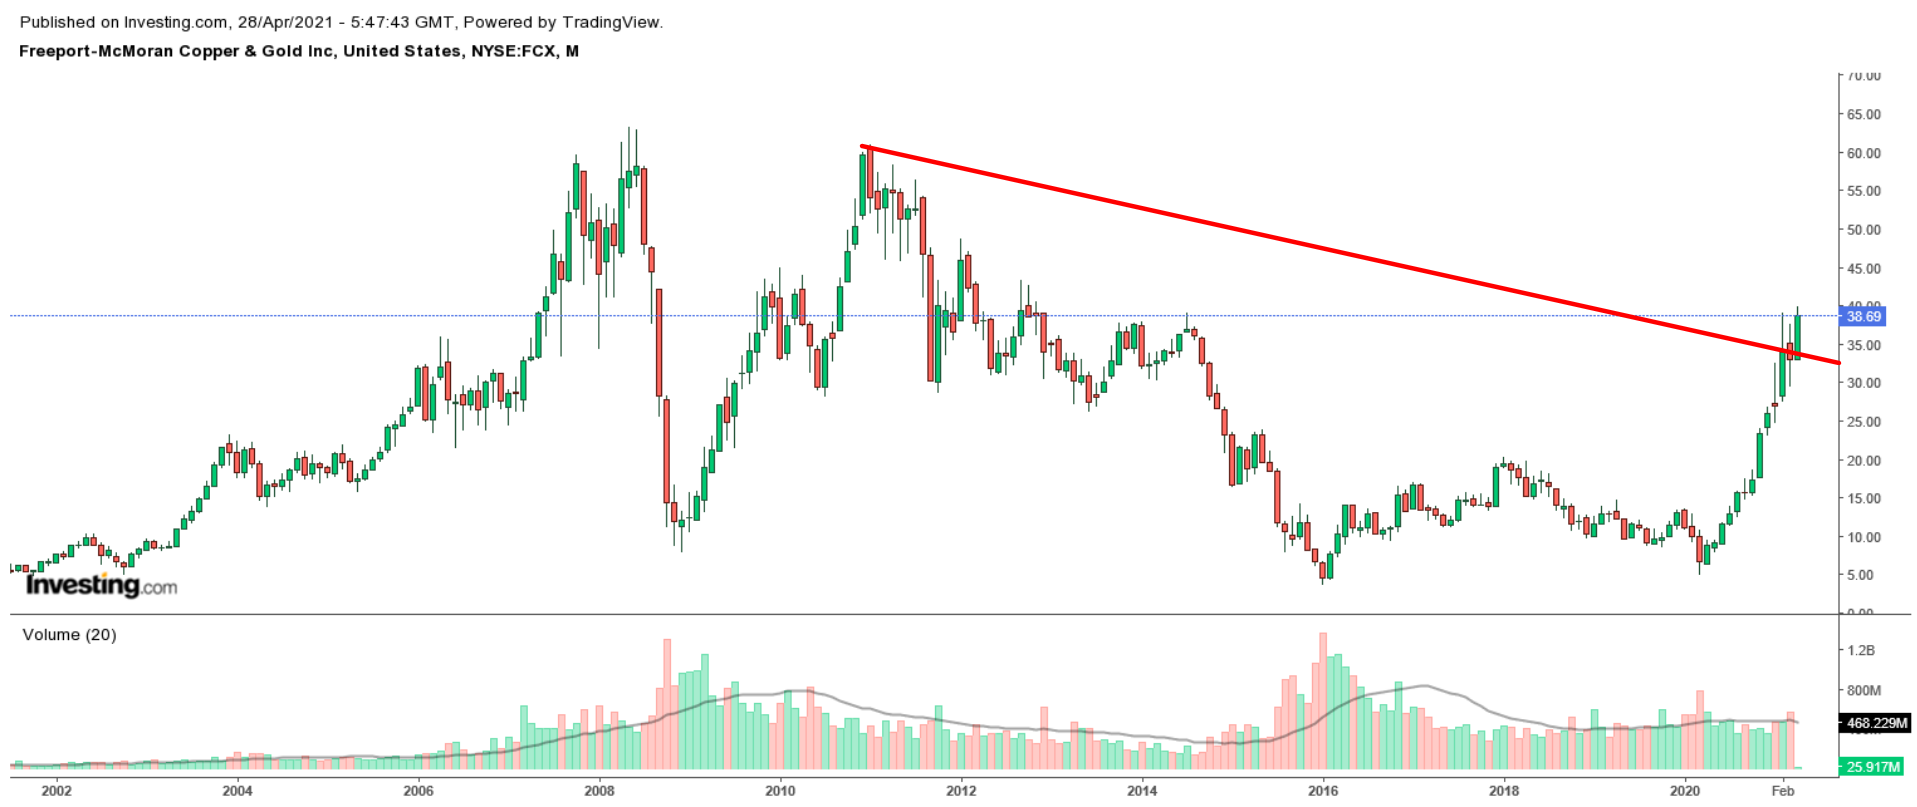
Freeport stock rose to its highest level since November 2012 on Tuesday, before closing at a near decade-high of $38.69, giving the Phoenix, Arizona-based miner a market cap of around $53.6 billion.
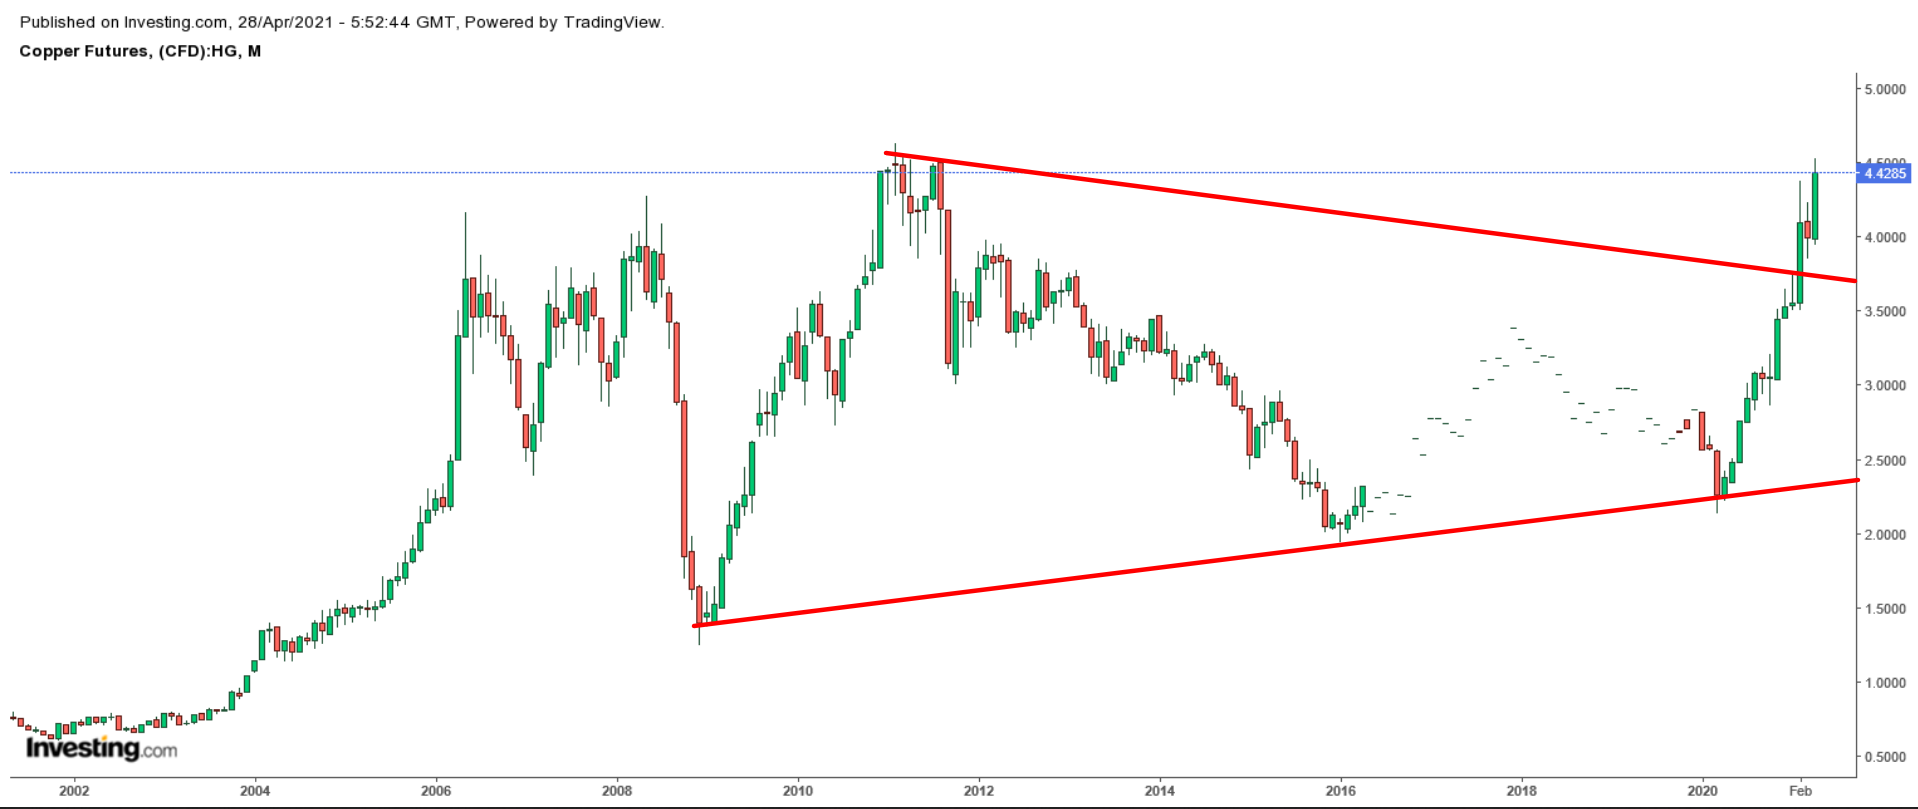
As one of the world’s leading copper producers, it has enjoyed a surge in prices of the red metal, which recently climbed above the $4.50-level for the first time since March 2011. Those prices are more than double from where they were one year ago, when COVID-related shutdowns drove down futures to below $2.20.
Investor sentiment was lifted further last week, when Freeport announced earnings and revenue which improved substantially from the year-ago period, thanks in large part to higher sales volumes, and rising prices for copper.
The miner said it swung to a first quarter profit of $0.51 per share, compared to a loss per share of $0.16 in the same quarter last year. Revenue, meanwhile, climbed 74% year-over-year to $4.85 billion, representing the strongest sales growth in more than eight quarters.
Copper accounted for about 80% of revenue during the reported quarter, Freeport said.
In a sign that bodes well for the future, Freeport-McMoRan boosted its 2022 target for copper sales to 4.3 billion pounds from 4.2 billion.
Honorable mentions: Southern (NYSE:SO) Copper (NYSE:SCCO), Rio Tinto (NYSE:RIO), and Valero Energy Corporation (NYSE:VLO)
2. Weyerhaeuser
- Year-To-Date Performance: +17.4%
- Market Cap: $29.2 Billion
Weyerhaeuser (NYSE:WY)—one of the world's largest private owners of timberlands—is the biggest softwood lumber manufacturer in the United States, ranking first in the industry for lumber production capacity. It is also one of the largest manufacturers of wood products in North America.
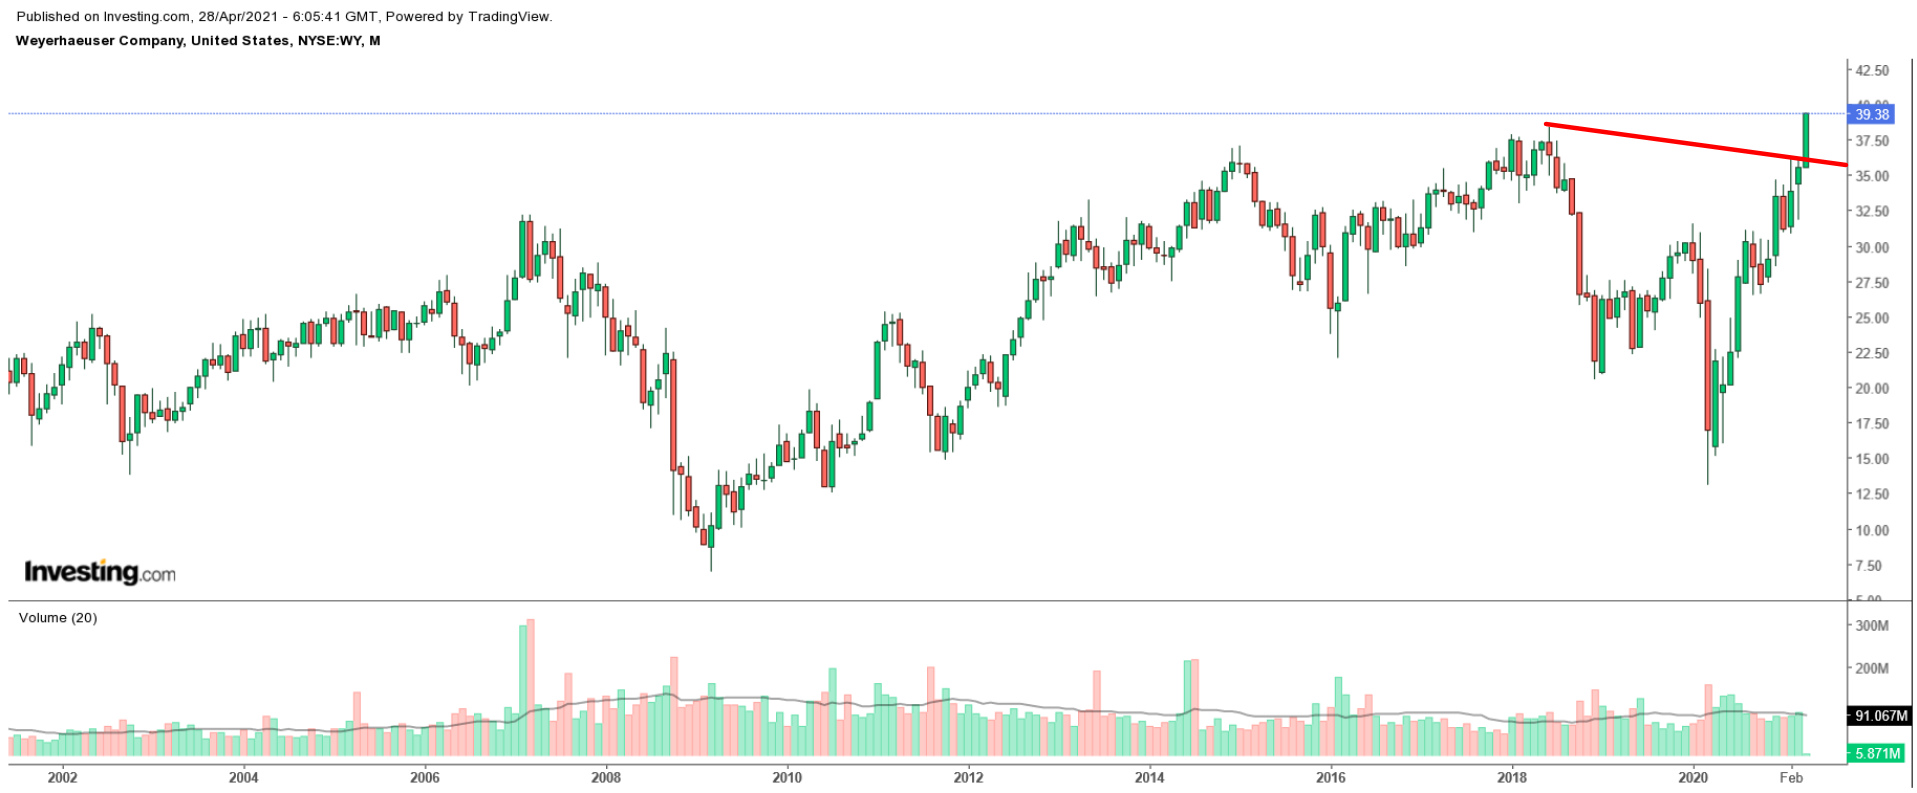
Shares of the Seattle, Washington-based timber real estate investment trust (REIT) have easily outperformed the broader market over the past year, gaining 200% since falling to a 10-year low of $13.10 in March 2020. Year-to-date, shares have climbed more than 17%, reaping the benefits of higher lumber prices.
WY stock climbed to an all-time high of $39.87 yesterday, before ending at $39.38. At current levels, Weyerhaeuser has a market cap of $29.2 billion.
Weyerhaeuser, which owns or controls approximately 11 million acres of timberland in the U.S., with an additional 14 million acres licensed in Canada, is expected to continue to benefit from improving lumber market fundamentals in the months ahead.
Prices of the natural resource have more than tripled in the past year, rallying 350% due to a potent combination of pandemic-related supply chain issues and soaring demand from homebuilders amid a booming U.S. housing market.
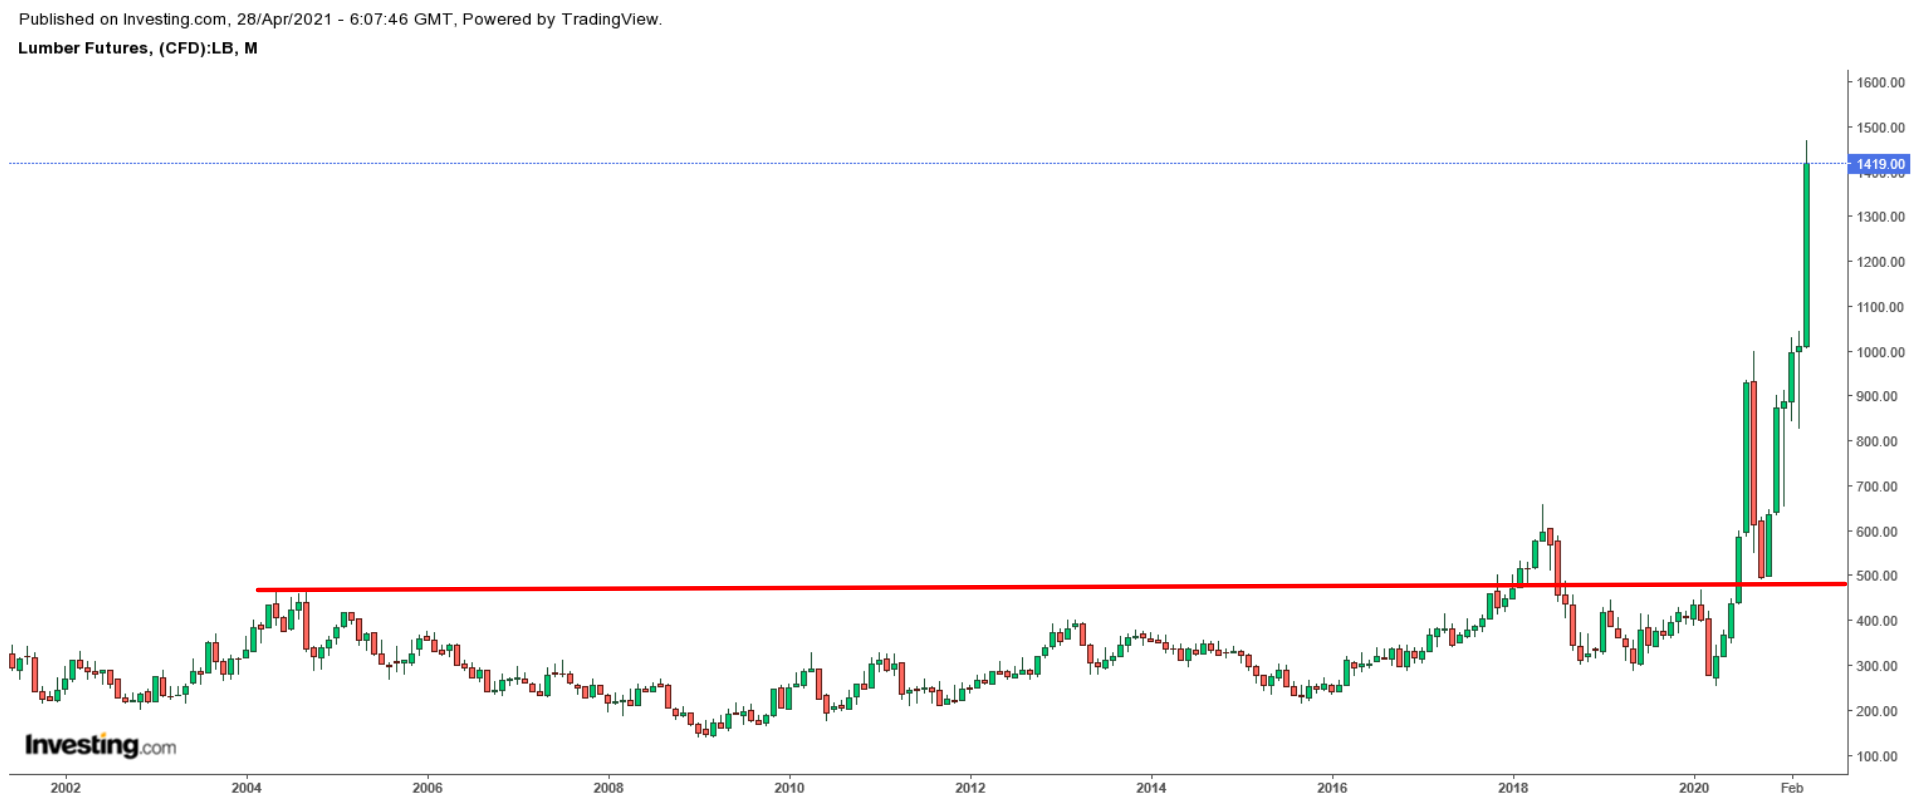
WY is scheduled to report first quarter earnings on Friday, Apr. 30, before U.S. markets open. Consensus estimates call for earnings of $0.88 per share on revenue of $2.52 billion, up 389% and 46% respectively from the year-ago period.
Beyond the top- and bottom-line figures, investors are hoping the company will update its full-year guidance to reflect the positive impact of skyrocketing lumber prices on its business.
Honorable mentions: West Fraser Timber (NYSE:WFG, Boise Cascade (NYSE:BCC), and Universal Forest Products (NASDAQ:UFPI)
3. Bunge
- Year-To-Date Performance: +34.7%
- Market Cap: $12.2 Billion
Bunge Limited (NYSE:BG) is one of the world’s leading agribusiness and food companies. Its core business involves purchasing, storing, transporting, processing, and selling agricultural commodities and commodity products, primarily soybeans, corn, and wheat, as well as rapeseed, canola, and sunflower seeds.
As such, the ongoing rally in grains prices should bode well for the company in the months ahead. Corn futures jumped to their highest level since 2013 at the start of the week, while soybeans and wheat also rallied to multi-year peaks.
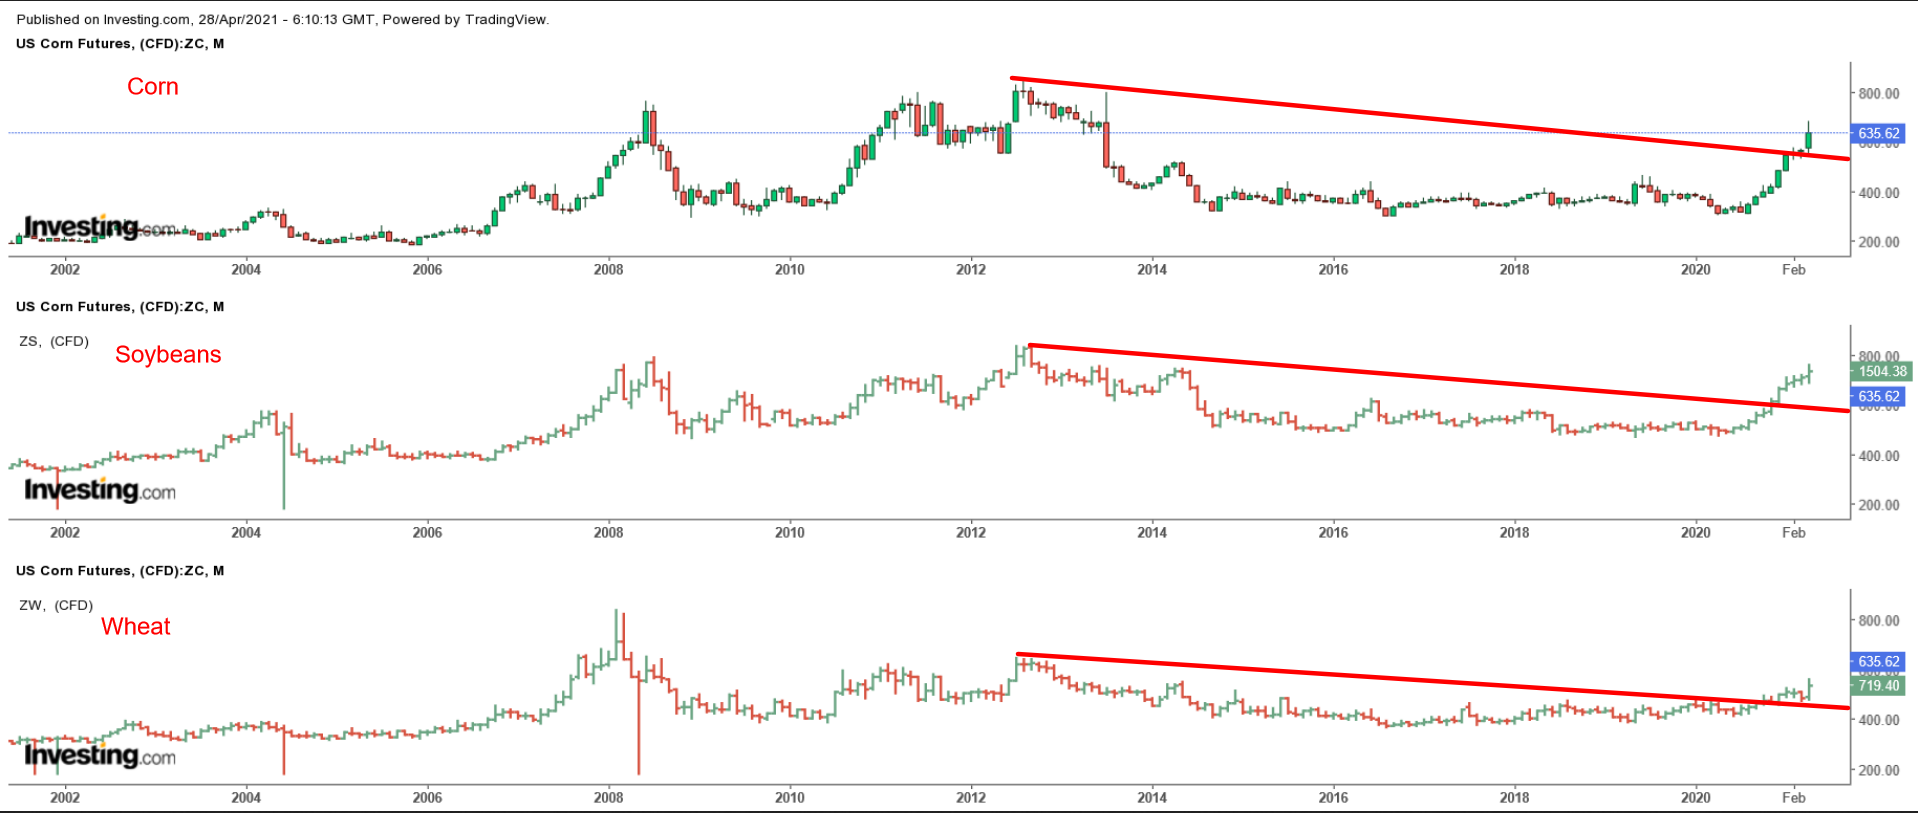
The St. Louis, Missouri-based grain and oilseeds processor has seen its shares jump by around 123% over the past 12 months, far outpacing the returns of both the Dow Jones Industrial Average and the S&P 500.
BG stock rose to a fresh peak of $88.84 on Tuesday, a level not seen since July 2015, before settling at $88.34, giving it a market cap of roughly $12.2 billion.
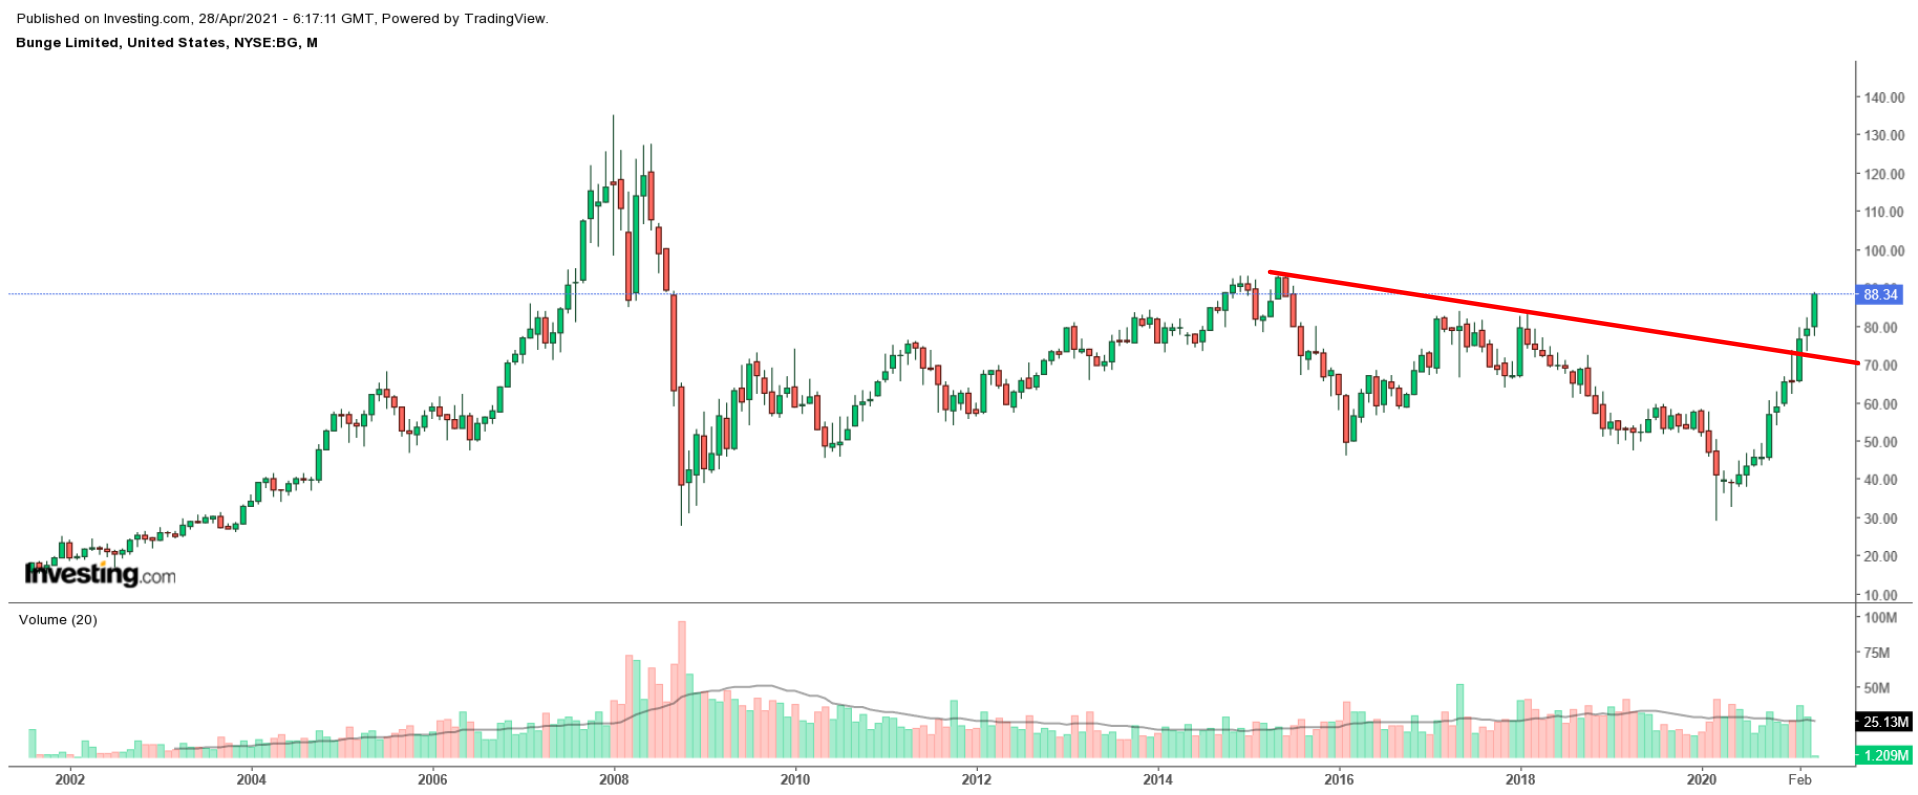
Bunge, which crushed expectations for its fourth quarter earnings and revenue in early February, next reports financial results ahead of the U.S. market open on Tuesday, May 4.
Consensus estimates call for the agriculture giant to post earnings per share of $1.54 for its first quarter, improving from a loss of $1.34 per share in the year-ago period.
Revenue is expected to clock in at $10.2 billion, increasing 11% from sales of $9.2 billion in the same period a year earlier amid a strong performance in the grains merchant’s core agricultural services and oilseeds unit.
Taking that into consideration, BG stock still looks attractive going forward—despite strong year-to-date gains—considering its leading position in the global grains industry.
Honorable mentions: Archer-Daniels-Midland (NYSE:ADM), Corteva (NYSE:CTVA), and Deere (NYSE:DE)
