Despite the impressive gains in broader markets}} and several industries in 2020, not every sector, company or investment theme was a winner last year.
We covered several of these laggards in recent articles, including numerous industries and exchange-traded funds (ETFs). Today's article continues the discussion with a detailed look at two more ETFs.
1. iShares Latin America 40 ETF
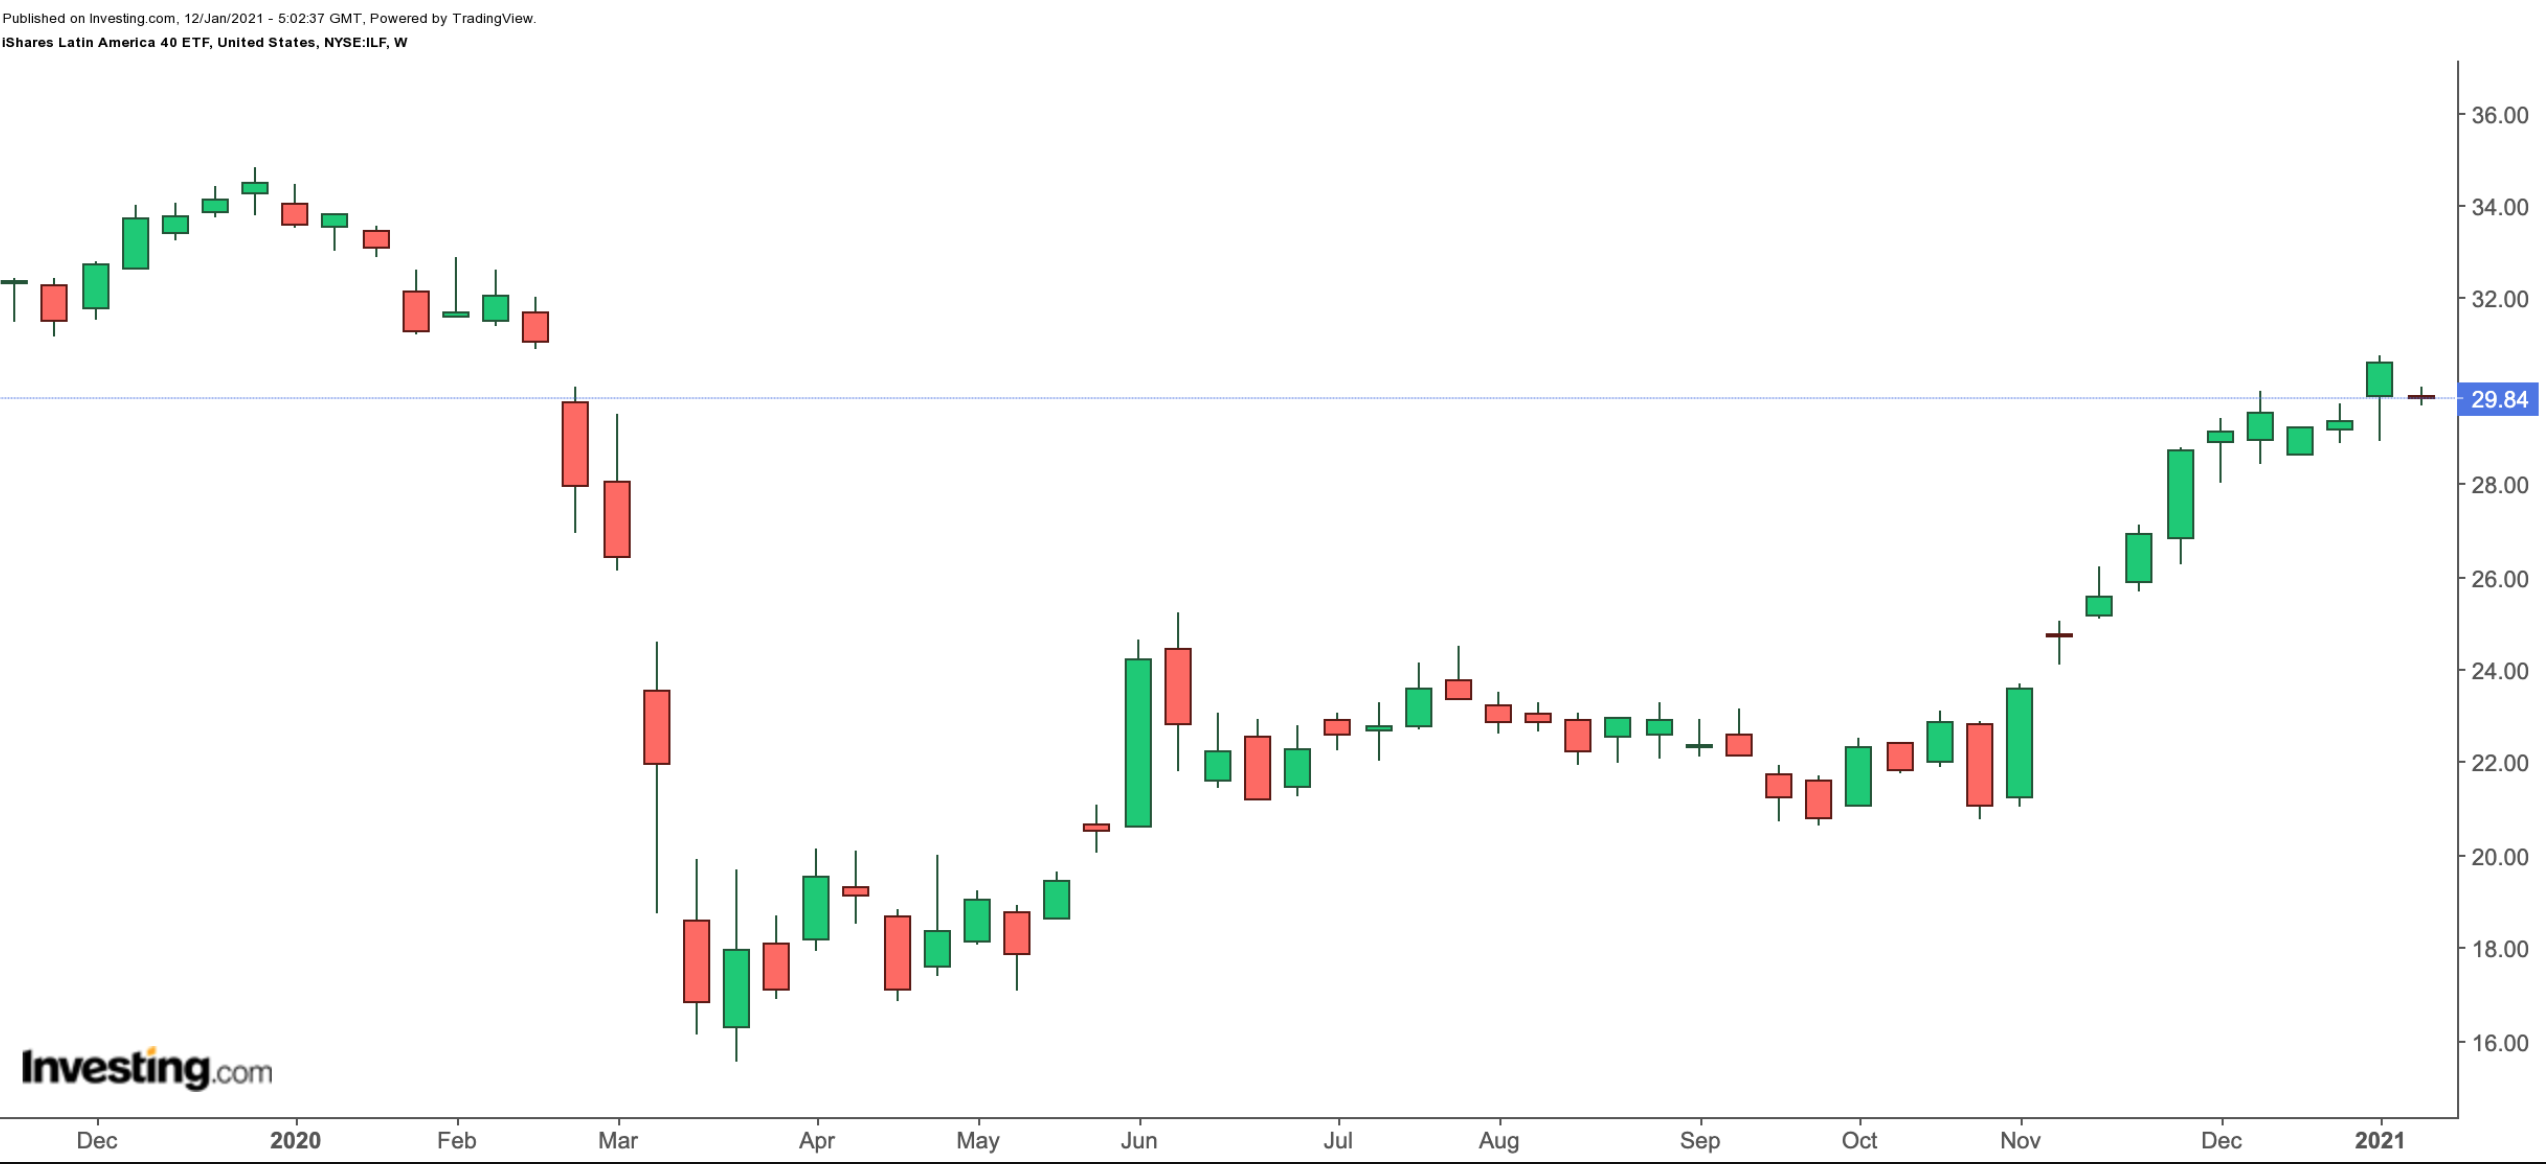
- Current Price: $29.84
- 52-Week Range: $15.54 - $34.31
- Dividend Yield: 1.82%
- Expense Ratio: 0.48%
Our first fund, namely the iShares Latin America 40 ETF (NYSE:ILF), takes us outside the US, providing exposure to 40 Latin American businesses.

ILF, which tracks the S&P Latin America 40 Index (SPLAC), started trading in October 2001. Assets under management stand at $1.62 billion.
In terms of sectors, financials have the highest weighting (29.46%), followed by materials (24.09%), energy (13,06%), consumer staples (12,56%), information technology (5,54%), communication (5.01%), and others.
Around 55% of the funds are in the top ten stocks. The first five holdings come from Brazil. They include Vale (NYSE:VALE), one of the largest producers of iron ore, pellets, and nickel worldwide, financial services groups Itau Unibanco (NYSE:ITUB) and Banco Bradesco (NYSE:BBD), oil and natural gas group Petroleo Brasileiro (NYSE:PBR) and regional stock exchange Brasil Bolsa Balcao (SA:B3SA3). Close to 60% of the businesses are, in fact, Brazil-based, followed by Mexico (20.87%), Chile (7.69%), and others. At this point, the fund has no exposure to Argentina.
Over the past year, ILF is down close to 10%. Yet, we should note that since late October, the fund has returned over 50%. Its trailing P/E and P/B ratios are 15.54 and 2.23. Although not overly expensive, the valuation is still on the frothy side. Therefore, some profit-taking is likely. Potential investors, especially those who would like an overweight exposure to Brazil and Mexico, could consider investing when shares are around $28.
We'd also like to remind readers that the fund's performance would in part depend on the currency dynamics vis-à-vis the {{8827|US dollar. Put another way, a volatile US dollar could affect returns in Emerging Markets (EMs). In the case of a potentially depreciating greenback in 2021, EM funds could benefit.
2. Arrow Dow Jones Global Yield ETF
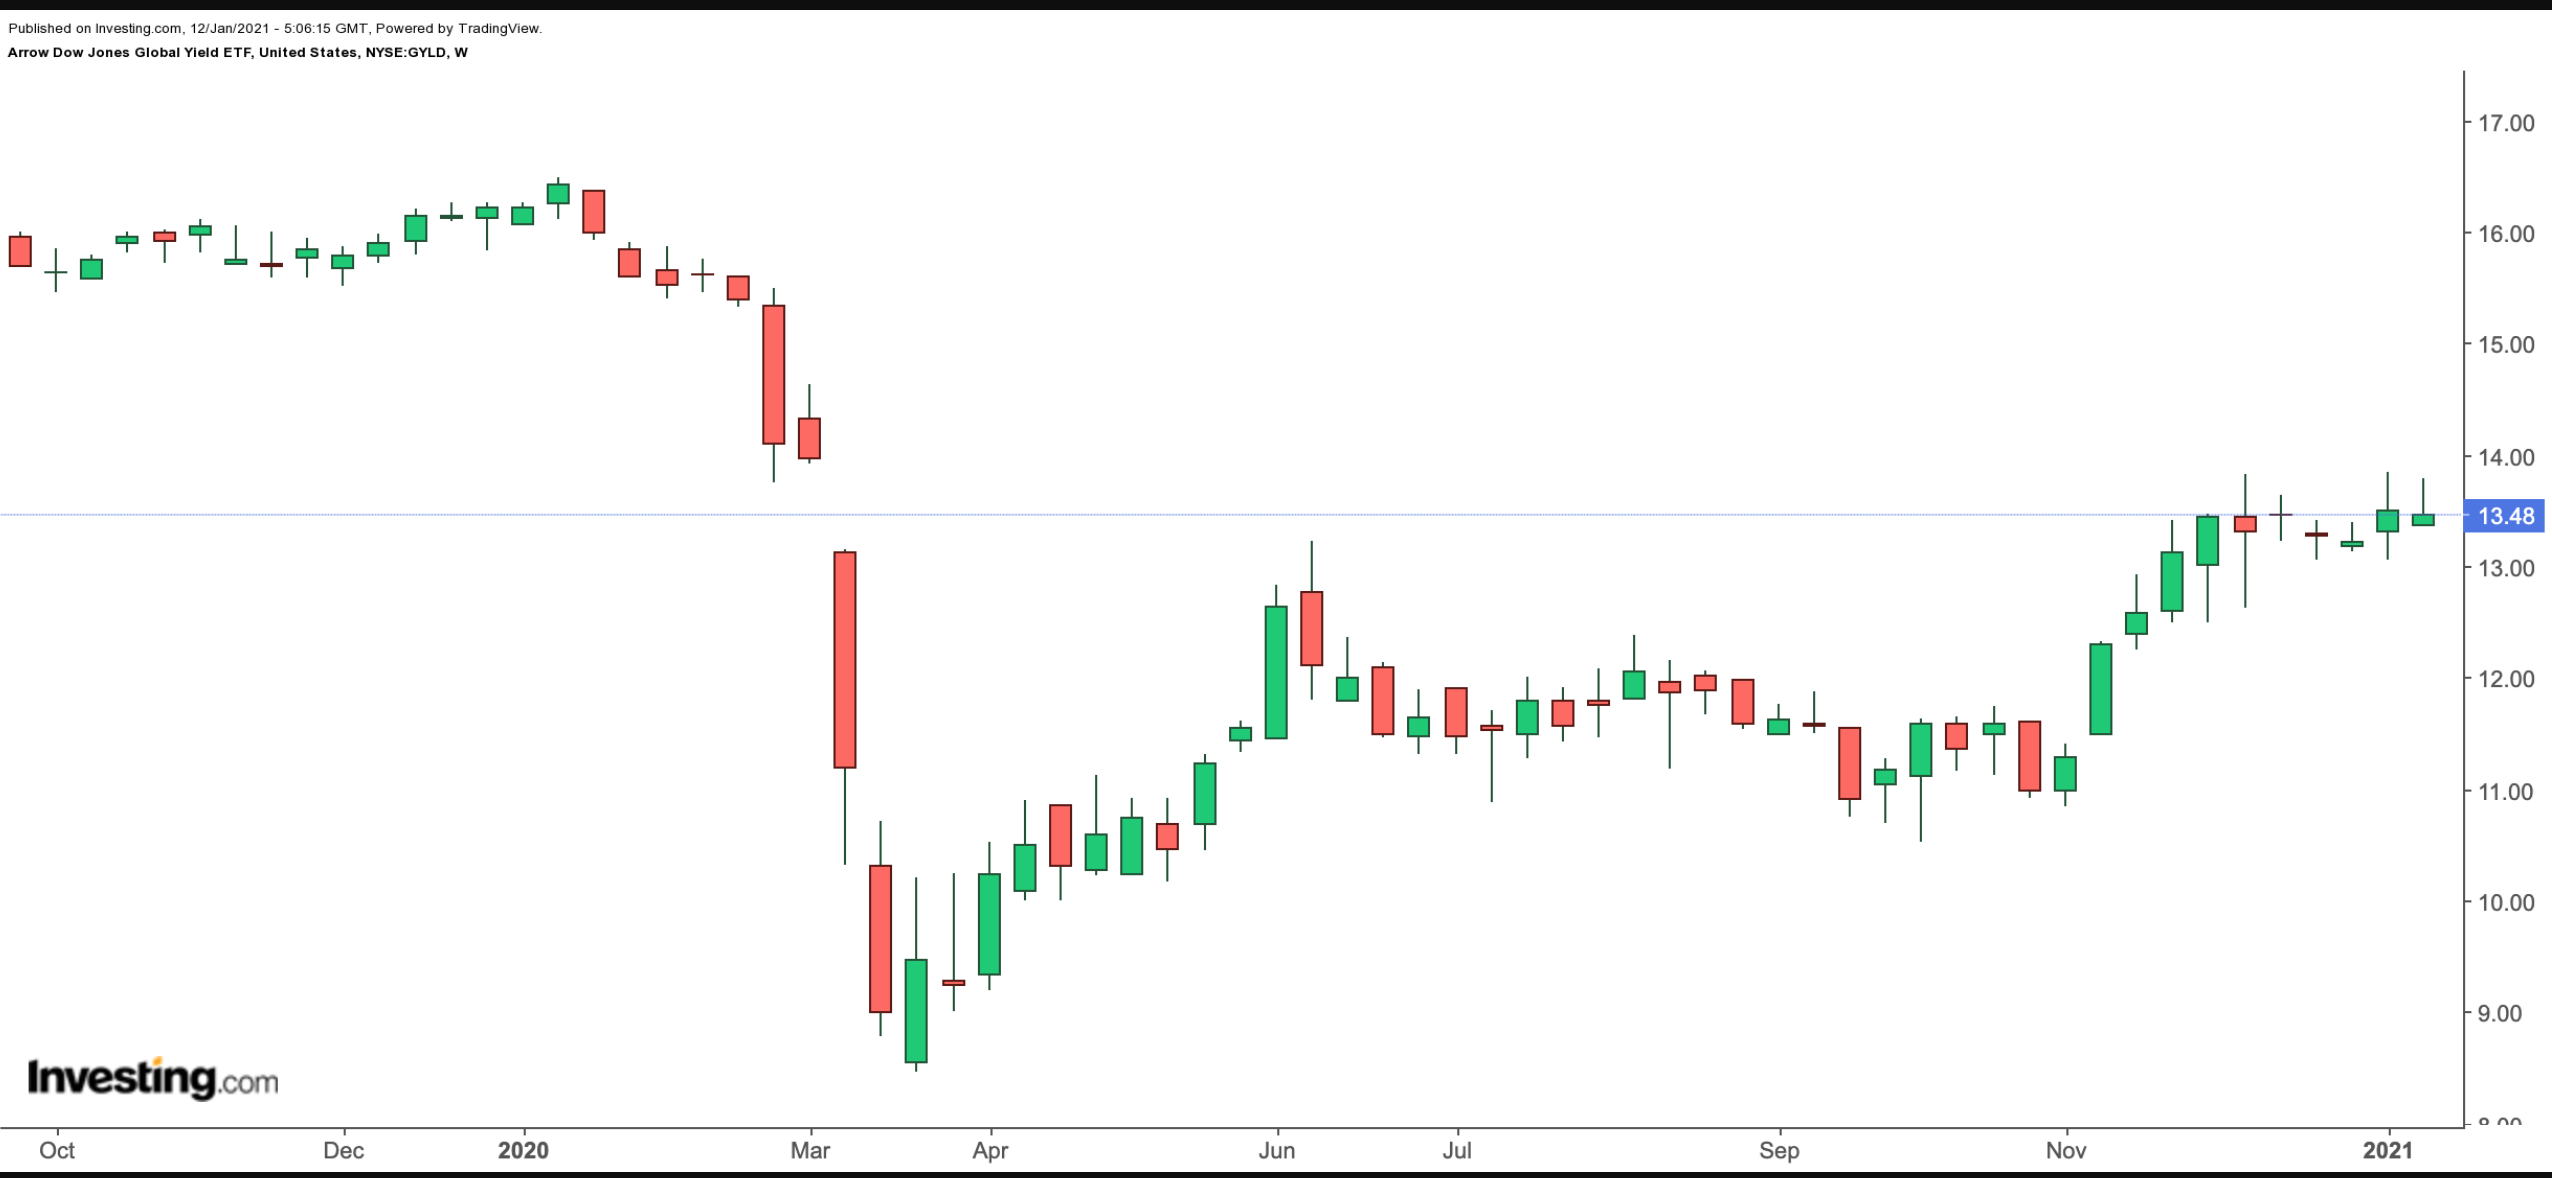
- Current Price: $13.48
- 52-Week Range: $8.47 - $16.50
- Dividend Yield: 7.35%
- Expense Ratio: 0.75%
The fund could possibly appeal to passive-income seekers with a global focus. The Arrow Dow Jones Global Yield ETF (NYSE:GYLD) gives equally-weighted exposure to five asset classes worldwide. They include equity, real estate investment trusts (REITs), alternatives (including energy and master limited partnerships, MLPs), corporate debt and sovereign debt.

GYLD has 150 holdings, typically 30 from each asset class. It tracks the Dow Jones Global Composite Yield Total Return Index, which is balanced quarterly. The fund started trading in August 2012. Assets under management are almost $39 million.
The ETF is down about 17% in the past year and the fund's current price supports a yield of 7.35%. Over the past 52 weeks, the five asset classes have provided a range of yields, including:
- Global Equity: 11.37%
- Global Real Estate: 9.17%
- Global Alternative: 19.99%
- Global Corporate Debt: 7.09%
- Global Sovereign: 3.90%
Under equities and alternatives, we find names like Bankia (OTC:BNKXY), BP (LON:BP) Midstream Partners (NYSE:BPMP), CenturyLink (NYSE:LUMN), China China Shenhua Energy (OTC:CSUAY), Dorchester Minerals (NASDAQ:DMLP), Energy Transfer (NYSE:ET), EVRAZ (OTC:EVRZF), Kimbell Royalty Partners (NYSE:KRP), and NuStar Energy (NYSE:NS).
REITs in GYLD include Brandywine Realty Trust (NYSE:BDN), Klepierre (PA:LOIM), Office Properties Income Trust (NASDAQ:OPI), Simon Property Group (NYSE:SPG) and Ventas (NYSE:VTR).
Corporate debt comes from global businesses, such as Cenovus Energy (NYSE:CVE), Fluor (NYSE:FLR), Kennedy-Wilson (NYSE:KW), Nordstrom (NYSE:JWN), Oceaneering International (NYSE:OII) and Tofas Turk Otomobil Fabrikasi (IS:TOASO)
Finally, sovereign debt has been issued by numerous countries, including Brazil, Chile, Colombia, Hungary, Indonesia, Mexico, Panama, South Africa, and Turkey. Those sovereigns typically pay more than developed economies.
GYLD offers a basket of five payout streams with a worldwide focus. However, we have to remind readers that in recent years, international exposure has mostly been lower than the broader performance offered by US securities. Therefore, exposure should possibly be limited to a small portion of a diversified portfolio.
