Get 40% Off
🚨 Volatile Markets? Find Hidden Gems for Serious Outperformance
Find Stocks Now

Keep an Eye on This Inverse Head & Shoulders Stock Chart

Published 24/04/2024, 04:02 pm
© Reuters.

While hunting for stocks that have a high probability of a reversal from downtrend to uptrend, a popular Inverse Head & Shoulders chart pattern makes it to the list of top choices among market participants.

The same pattern is getting formed on the daily chart of Craftsman Automation Ltd (NS:CRAF). It is an engineering company in the automotive space with a market capitalization of INR 9,091 crore and trades at a TTM P/E ratio of 28.43.

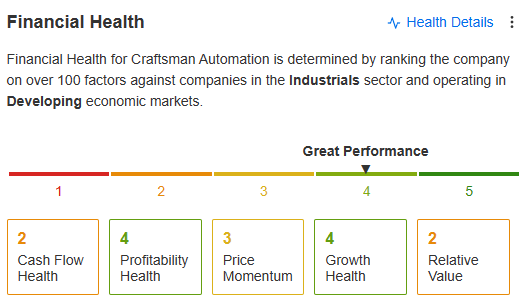
Image Source: InvestingPro+

The stock has been given a financial health score of 4 out of 5 which makes it almost an excellent choice for the portfolio. Such ratings are derived after analyzing over 100 parameters across various verticals such as relative valuation, cash flows, profitability, etc. Any stock with a rating of 3 or above can be considered for investment and blended with other factors to arrive at a much-rounded approach.

Although the fair value of the stock is INR 4,610, leaving a valuation gap of INR 2.6% from the CMP, analysts are quite bullish on the counter. A total of 7 are covering this stock with an average target price of INR 5,309 per share. That’s a decent upside of around 18%.

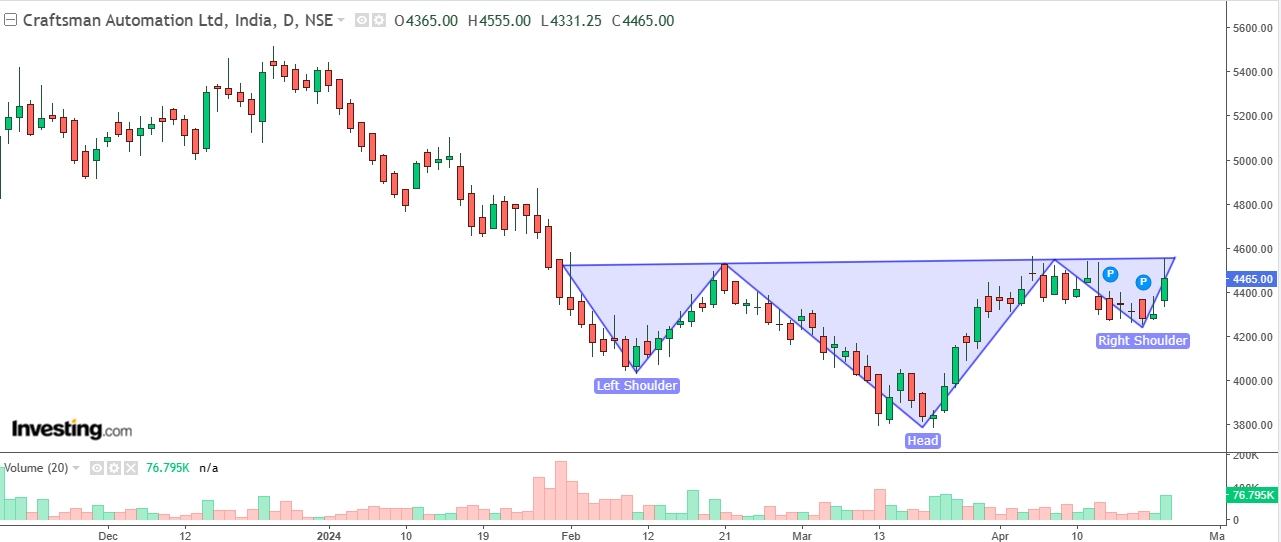
Image Source: Investing.com

On the technical front, the stock’s Inverse H&S pattern is pointing out to a target of INR 5,250 - 5,300, almost in line with analysts’ estimate.

Investors can combine analysts’ targets, fair value and technical levels to develop a holistic approach toward investing. InvestingPro makes it easier to follow this powerful framework and it is now available at a steep discount of up to 69%, for INR 216/month. Click here to grab your limited-time opportunity today!

3rd party Ad. Not an offer or recommendation by Investing.com. See disclosure here or remove ads .

X (formerly, Twitter) - Aayush Khanna

Latest comments

Risk Disclosure: Trading in financial instruments and/or cryptocurrencies involves high risks including the risk of losing some, or all, of your investment amount, and may not be suitable for all investors. Prices of cryptocurrencies are extremely volatile and may be affected by external factors such as financial, regulatory or political events. Trading on margin increases the financial risks.
Before deciding to trade in financial instrument or cryptocurrencies you should be fully informed of the risks and costs associated with trading the financial markets, carefully consider your investment objectives, level of experience, and risk appetite, and seek professional advice where needed.
Fusion Media would like to remind you that the data contained in this website is not necessarily real-time nor accurate. The data and prices on the website are not necessarily provided by any market or exchange, but may be provided by market makers, and so prices may not be accurate and may differ from the actual price at any given market, meaning prices are indicative and not appropriate for trading purposes. Fusion Media and any provider of the data contained in this website will not accept liability for any loss or damage as a result of your trading, or your reliance on the information contained within this website.
It is prohibited to use, store, reproduce, display, modify, transmit or distribute the data contained in this website without the explicit prior written permission of Fusion Media and/or the data provider. All intellectual property rights are reserved by the providers and/or the exchange providing the data contained in this website.
Fusion Media may be compensated by the advertisers that appear on the website, based on your interaction with the advertisements or advertisers.
© 2007-2024 - Fusion Media Limited. All Rights Reserved.