As an investor, it is crucial to differentiate attractive dividend-paying stocks and yield traps.
What is a yield trap?
Yield traps are stocks that have an appealing dividend yield primarily due to a declining share price, but underlying business fundamentals are weak, that is, at risk of earnings downgrades over time.
These companies are often financially unhealthy, and commonly finance dividend payments through excessive borrowings.
The importance of financial health
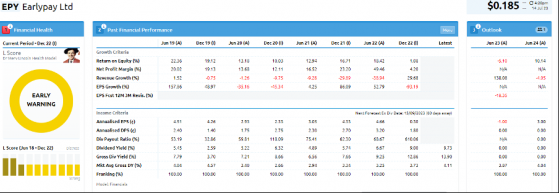
In simple terms, Financial Health assesses a company’s risk of insolvency by determining whether the quality of its cash flow and profits can service its debt obligations. With slower economic growth and rising interest rates, many companies are facing increased interest costs and cash flow issues. This in turn, increases the risk that companies are unable to maintain its dividend going forward.
The example below displays Earlypay Ltd (EPY) – An invoice finance business focusing on the SME market. EPY have faced significant headwinds in rising interest costs and bad debts which have been long flagged by our Financial Health rating system, and hence why we avoided the stock despite a historically attractive yield at over 9%.
Source: Stock Doctor
Monitoring share price sentiment and earnings revisions
One effective method to avoid yield traps is to closely monitor earnings revisions and share price sentiment (Stock Doctor’s Golden Rule 3 and 4). Negative earnings revisions and declining share prices often signal that the seemingly attractive yield may be unsustainable.
In the example below with EPY, there has been a significant decline in the share price over the last two years which has corresponded with a decline in forecast earnings per share. Notice how there were consecutive downgrades that pre-empted the share price collapse, this phenomenon highlights the risk of ‘buying the dip’ for a potential yield trap, as your capital loss is likely to exceed potential income.
Source: Stock Doctor
The significance of free cash flow
For investors focusing on industrial and resources companies, analysing the trend of free cash flow is instrumental in assessing a company's cash-generating ability. Free cash flow represents the net cash flow from operations after deducting sustaining capital expenditure.
It is essential to look for companies with sufficient free cash flow margins above dividend payments, as this indicates their ability to sustain dividends in the long term.
In the example below with Telstra, you can see that there is a significant margin between free cash flow and dividend payments. The payout ratio has exceeded 100% of reported earnings which may appear unsustainable, however, this figure includes significant non-cash expenditures such as depreciation and amortisation. Therefore, income-seeking investors should focus on cash flows. The wide margin between cash flow and dividends ensures there is sufficient buffer to pay dividends.
Source: Stock Doctor
Finally, declining free cash flow does not always indicate an imminent dividend cut. Some companies may be making substantial growth investments and possess sufficient cash reserves to maintain dividends in the near term. In such cases, a qualitative assessment becomes crucial for understanding the sustainability of the yield.
Stock Doctor's research team can provide valuable insights into evaluating these risks and assessing yield sustainability.
The path to informed investment decisions
In the current economic environment, characterised by slowing growth and higher interest rates, a cautious analysis of dividend-paying stocks is essential. Many dividend-paying companies may represent yield traps, making it vital for investors to analyse the underlying fundamentals of the business.
By considering factors such as financial health, earnings revisions, share price sentiment, cash flow trends, dividend payment history, and payout ratios, investors can make better-informed decisions and avoid yield traps.
However, quantitative metrics alone may not be enough. A comprehensive qualitative assessment plays a vital role in understanding dividend sustainability and avoiding potential pitfalls.
Stock Doctor's 9 Golden Rule framework, along with its tools and access to analyst research, helps investors identify high-yield stocks that provide a sustainable and regular income stream for their ongoing financial needs and retirement. Maximise your investment potential and avoid yield traps with a Stock Doctor 14-day trial.
Daniel Ortisi is an equity research analyst with the team at Stock Doctor and is responsible for coverage across the mining and materials sector. Daniel has had previous experience working within deal advisory, M&A and financing across a variety of industries, with a speciality in financial analysis and modelling.
Read more on Proactive Investors AU
