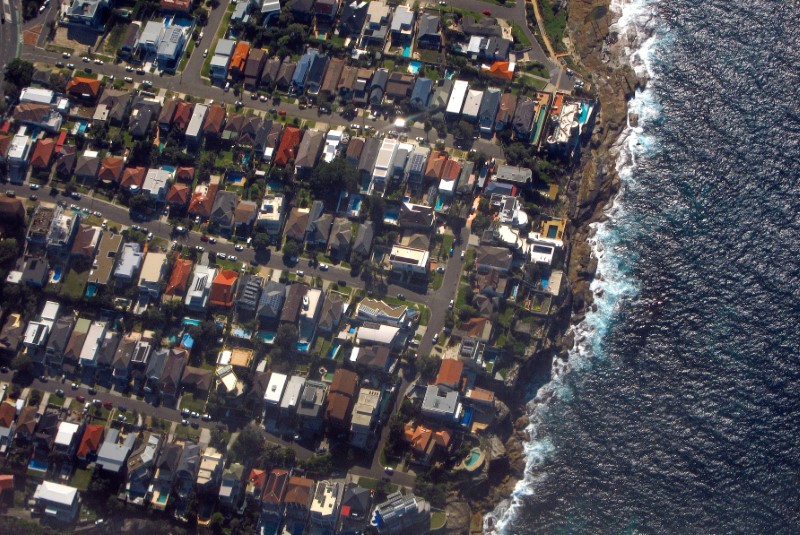
The busiest capital city suburbs for auctions this week are in NSW and Vic, where Footscray tops the list with 8 homes set to be auctioned. Manly (NSW) and Craigieburn (Vic) follow closely with 7 scheduled auctions each.
Upcoming Auctions
The combined capital cities will see an uplift in auction activity this week, with 874 homes set for auction. While this is a considerable increase on the 536 homes auctioned last week, volumes are down 40 per cent year on year (1,470).

The most substantial increase in volumes this week are across the two largest auction markets of Melbourne and Sydney, where over double the number of homes are expected to go to auction over the week. Melbourne will see 331 homes taken to auction this week, while Sydney has 302 auctions scheduled.
Brisbane and Canberra are the only auction markets were fewer homes are scheduled for auction this week compared to last.

If we compare volumes to the same week last year, volumes are down significantly across Canberra (-43.8%), Melbourne (-46.5%), Perth (-34.6%), Sydney (-42.1%) and Tasmania (-45.5%), while Adelaide (-5.1%) and Brisbane (-25.2%) volumes are down to a lesser degree.
Summary of Last Week’s results
There were 536 capital city homes taken to auction over the first week of February, returning a final auction clearance rate of 42.8 per cent; continuing on from what we were seeing at the end of last year when the weighted average fell to the low 40 per cent range in early November and remained there each week throughout December. One year ago, a much higher 62 per cent of the 790 homes taken to auction sold over the equivalent week.

There were 162 Melbourne homes taken to auction last week, returning a final auction clearance rate of 44.3 per cent. A significantly lower result compared to one year ago, when 292 auctions were held across the city and 70.2 per cent were successful.
In Sydney, 130 auctions took place with 49.5 per cent clearing. One year ago, a higher 216 auctions took place when a 57.1 per cent clearance rate was recorded.
Across the smaller auction markets, results were varied with 46.2 per cent of Canberra homes selling, while Perth returned a 15.4 per cent final clearance rate.
Geelong was the best performing regional auction market last week, with 43.8 per cent of auctions clearing.

