(Adds graphics)
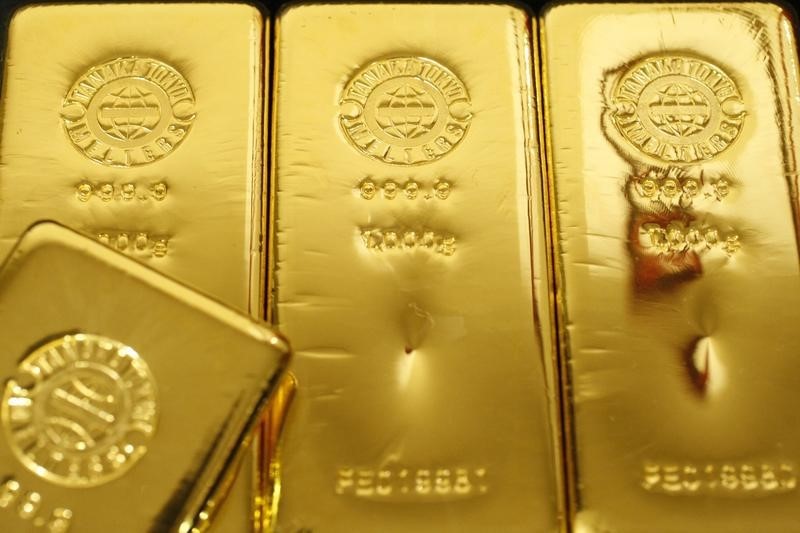
April 6 (Reuters) - Perth Mint's gold sales climbed to their highest since at least 2012 in March as a fall in prices of the metal lifted demand for minted products, the refiner said in a blog post on Tuesday.
Sales of gold coins and minted bars jumped to more than 130,000 ounces in March, up 4.8% month-on-month and 39% from a year earlier.
"The market continues to take everything we can make at present," said Neil Vance, general manager at Minted Products, noting above average demand in key markets like the United States and Germany.
Benchmark spot gold prices XAU= fell for a third consecutive month in March, with a drop of 1.5%. Over the first quarter they were down almost 10%, the biggest such fall in more than four years.
Silver sales, meanwhile, declined 12.6% to about 1.6 million ounces last month.
"...interest in silver is outstripping our capacity to convert plentiful supplies into finished goods," Vance said.
In the first quarter this year, the Perth Mint sold more than 330,000 ounces of gold, and more than 4.5 million ounces of silver, according to Jordan Eliseo, manager of listed products and investment research at the mint.
"These figures represent the highest calendar quarter on record for gold, and the fourth highest calendar quarter on record for silver."
Silver prices XAG= fell for a second month in March, by 8.4%, and were down 7.5% over the first quarter. Perth Mint, owned by the government of Western Australia, refines more than 90% of the newly mined gold in Australia, one of the world's top gold producers.
Period
Gold (oz)
Silver (oz)
(year-month)
2021-Mar
130,000
1,600,000
2021-Feb
124,104
1,830,707
2021-Jan
76,103
1,162,884
2020-Dec
76,806
941,767
2020-Nov
84,158
1,119,269
2020-Oct
38,367
1,228,713
2020-Sept
62,637
1,677,383
2020-Aug
67,462
1,431,036
2020-July
56,104
1,567,900
2020-June
44,371
1,573,752
2020-May
63,393
997,171
2020-April
120,504
2,123,121
2020-March
93,775
1,736,409
2020-Feb
22,921
605,634
2020-Jan
48,299
1,450,317
2019-Dec
78,912
1,361,723
2019-Nov
54,261
1,027,695
2019-Oct
32,469
1,394,615
2019-Sept
46,837
1,350,038
2019-Aug
21,766
1,171,233
2019-July
21,518
987,040
2019-June
19,449
344,474
2019-May
10,790
681,582
2019-April
19,991
906,219
2019-March
32,757
935,819
2019-Feb
19,524
584,310
2019-Jan
31,189
828,854
2018-Dec
29,186
692,971
2018-Nov
64,308
876,446
2018-Oct
36,840
1,079,684
2018-Sept
62,552
1,305,600
2018-Aug
38,904
520,245
2018-July
29,921
486,821
2018-June
16,847
229,280
2018-May
14,800
557,120
2018-April
15,161
458,655
2018-March
29,883
975,921
2018-Feb
26,473
992,954
2018-Jan
37,174
1,067,361
2017-Dec
27,009
874,437
2017-Nov
23,901
544,436
2017-Oct
44,618
999,425
2017-Sept
46,415
697,849
2017-Aug
23,130
392,091
2017-July
23,675
1,167,963
2017-June
19,259
1,215,071
2017-May
29,679
826,656
2017-April
10,490
468,977
2017-March
22,232
716,283
2017-Feb
25,257
502,353
2017-Jan
72,745
1,230,867
<^^^^^^^^^^^^^^^^^^^^^^^^^^^^^^^^^^^^^^^^^^^^^^^^^^^^^^^^^^^ Perth Mint's March gold sales surge
https://tmsnrt.rs/2PYTc9I
^^^^^^^^^^^^^^^^^^^^^^^^^^^^^^^^^^^^^^^^^^^^^^^^^^^^^^^^^^^>
