Though it's currently being sold off, the price of oil is almost certain to rebound, likely north of $72 and probably even higher.
The fundamental obstacle until yesterday was the concern that OPEC and Russia would replenish any production shortfall by Venezuela and Iran. However after Wednesday's announcement indicating that won’t happen, traders were confident to buy the dip, bidding up prices again. Additionally, the API reported a build of 1.001 million barrels for the week ending May 25, beating estimates of 2.214 million barrels.
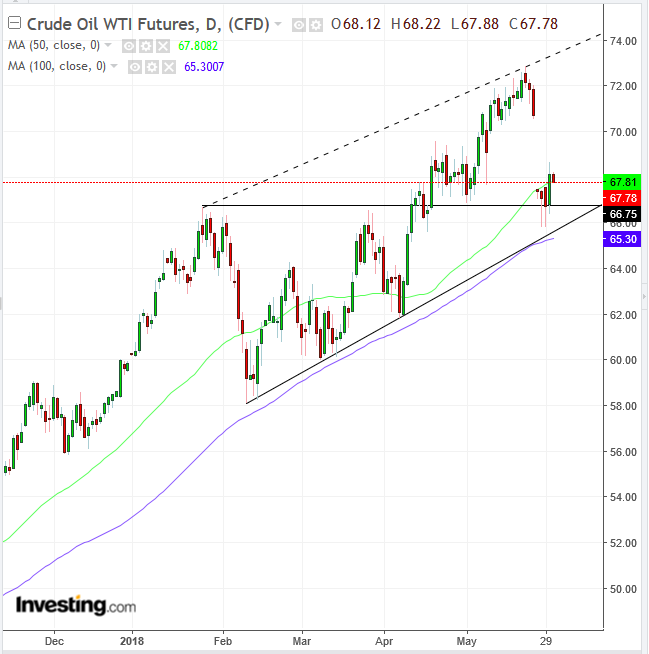
The commodity's technicals align with this assessment, demonstrating that despite the worst fundamental news in months for crude oil, when prices fell back to a consolidation, a tug of war between supply and demand seems to have ended with demand on top.

For almost four months, between January and April 17, the price of oil has been developing an ascending channel. The pattern reflects that while the price is passed between demand and supply, buyers are more committed. They were willing to initially buy only as low as $58 in February, raise to $60 in March and to $62 in April.
Sellers, on the other hand, were willing to sell above $66 in January and for the same, flat price in March. While the latter were willing to sell only when the price was right—high enough to make the risk of their being wrong worthwhile—buyers have proven more confident in their outlook, willing to risk higher and higher prices.
Their conviction was rewarded on April 18 when they broke through the bearish blockade, taking prices above $72, up almost 9 percent, in less than a month.
For those who missed the biggest move since January, there's a second chance up ahead. For those who profited the first time, it’s now Christmas in June.
To clarify, while we don’t know what will happen, the pattern’s support is holding despite a massive selloff, and climbing back since that crucial price level, finding support by the 100 DMA (blue) and crossing back above the 50 DMA (green). This is highly suggestive that it will resume its uptrend. Finally, the opportunity provides an exceptionally attractive risk-reward ratio, especially for those who wait for a closer entry to the support, upon a pullback.
Trading Strategies – Long Position Setup
Conservative traders may want to wait for a confirmation of the trend with a new peak, higher than the one on May 22, at $72.83.
Moderate traders may risk a long position on a pullback to at least the $66.75 price level of the triangle top, if not the $65.80 low of the Tuesday selloff.
Aggressive traders may enter a long position immediately, providing they can afford the stop-loss specified above or accept the risk of losing the position.
Equity Management
After establishing your risk aversion, manage your equity around the supports and resistance to provide you with a minimum of a 1:3 risk-reward ratio. Naturally, you can mix-and-match or even blend your risk aversion, as well as your equity management, per your trading strategies.
Trade Example
- Entry: $67.01
- Stop-loss: $65.71
- Risk: $1.30
- Target: $71.91
- Reward: $4.90
- Risk-Reward Ratio: almost 1:4
Naturally, the risk-reward ratio grows exponentially in the favor of the trader, the closer prices return to support areas, beneath which you place a stop-loss for a long position.
Patient Trade Example
- Entry: $66.01
- Stop-loss: $65.71
- Risk: $0.3
- Target: $71.91
- Reward: $5.90
- Risk-Reward Ratio: 1:20
