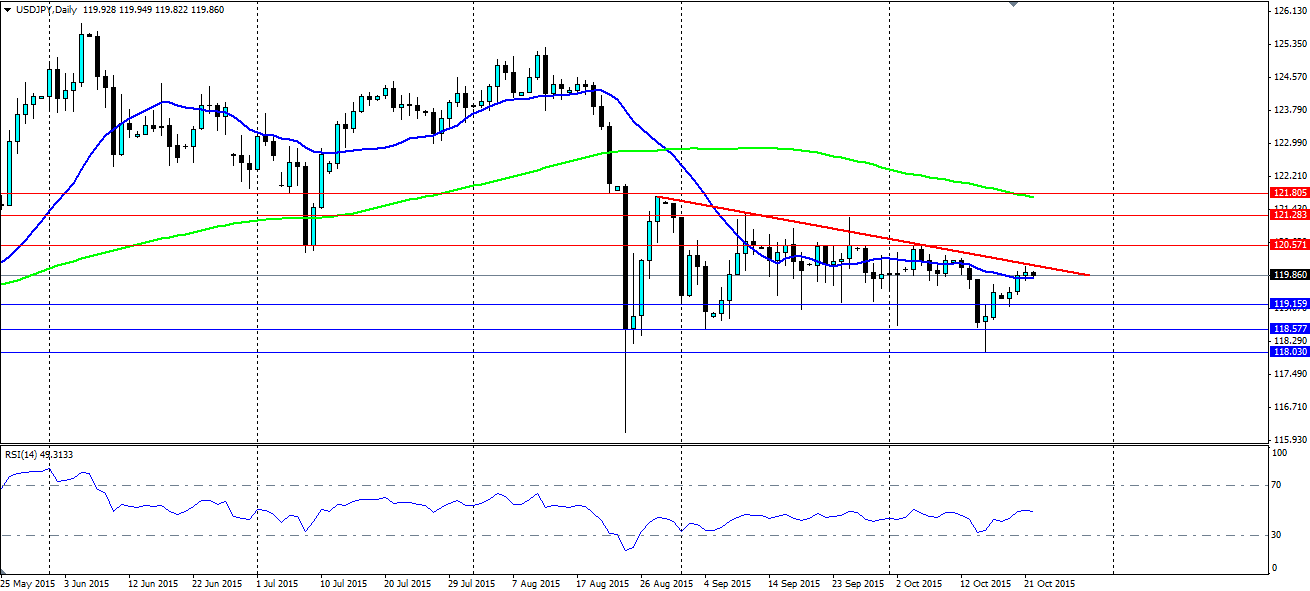
The yen has been under considerable pressure over the last week with some poor economic results, and a bullish US dollar. The USD/JPY pair has now run head first into the bearish trend line which could see the pair form another bearish leg back to the bottom of the range.
Late last week we saw Japanese industrial production slump -1.2% m/m, well down on the previous month’s result at -0.5%. This is again more evidence of a considerable slowdown in the Japanese manufacturing sector, largely thanks to the economic troubles in China. This week saw the machine tool orders result come in at -19.1% year on year.
Further weakness in the yen was found in the form of the trade balance. The market had forecast an improvement to -¥0.06t, so was understandably disappointed at the result at -¥0.36t. The result saw a big miss for exports, and a slightly better than expected import figure. Exports to the EU and the US were actually up, however, exports to China have fallen, highlighting the above issues facing the manufacturing sector.
BoJ Governor Kuroda said underlying inflation is improving and domestic demand is strengthening, despite worrying signs in the manufacturing sector. This will lessen the chances of more QE from the BoJ. The trade result will likely increase calls for further stimulus, however, the BoJ has (wisely) stated that they can do little about the performance of overseas economies. We will probably see a downgrade to GDP, but stimulus will remain on hold until there is a significant slowdown domestically.
A lack of stimulus will lead to yen strength and a test of the bottom of the range. The pressure the yen has been under recently has seen it run head first into the bearish trend that has been constraining the pair any time it moves higher. In fact, the lower highs are a good signal for a bearish bias on the USD/JPY.

The trend line has held since late August and looks to be holding firm at the moment as the pair consolidates under it, indicating a bearish move might be on the cards. A break below the 20 EMA on the daily chart will certainly be a cue for the bears to push it lower. The RSI is starting to swing lower having found itself in neutral territory. The room to the downside for the RSI indicates the pair could fall sharply before running into trouble.
If we see the pair form a bearish leg back down the chart, look for support at 119.15, 118.57 and 118.03. If we see a break of the dynamic resistance along the trend line, look for resistance to be found at 120.57, 121.28 and 121.80.
