Silver and gold prices have been trading at historic levels, with the yellow metal hitting a new record high, just over $1,933, earlier today. Silver surges above $24 an ounce at the time of writing.
Market volatility throughout 2020 has catapulted gold into the limelight for its safe haven status, and silver has joined the race higher, trading at 7-year highs.
Below we'll breakdown the key factors driving silver prices skyward as well as two silver exchange-traded funds (ETFs) worth considering in order to participate in this precious metals rally:
Beyond Jewelry And Utensils
The unique role silver plays in global markets impacts its price dynamics. Like gold, it is considered a precious metal and is used as an investment medium in the form of bullion, coins, jewelry, or utensils.
The combination of falling interest rates, a weaker US dollar, growing COVID-19 cases, and heightened US-China tensions are contributing to the rush into precious metals.
Adding to this, silver exhibits high electrical and thermal conductivity levels, so it has an essential role in industrial production with over 50% of the annual demand derived from industrial applications. For gold, the majority of demand comes from jewelry-making or investment purposes, with only 10%-15% from industrial use. As a result, the price moves of the two metals vary greatly.
For silver, economic growth can easily influence the prices, making it volatile.
Why Watch The Gold-To-Silver Ratio
Markets use the gold-to-silver ratio to calculate how many ounces of silver it would take to purchase one ounce of gold. Over time, prices of the two metals tend to move in tandem. Yet silver is often more mercurial, so the gold-to-silver ratio is unstable, changing drastically over time.
As of this writing, the ratio stands at 80.11, which theoretically means one could buy 80.11 ounces of silver for one ounce of gold.
Historically, it has been around 60. For example, in November 2008, the price of silver was around $8.50 and by March 2011, it had hit almost $46.50. Between that time frame, the gold-to-silver ratio was closer to its historical average.
In April 2020, the ratio was flirting with 115, and since then, Wall Street has been arguing that silver was rather cheap.
Many now think the ratio will eventually revert back to the mean—toward the 60-level. Such a move would either require the price of silver to rise or the price of gold to decline.
Although silver prices could indeed advance further in the long run, for now, there will probably be elevated levels of volatility.
Ways To Invest In Silver
Holding physical silver may be one option for investors looking to diversify a portfolio away from equities. In the US, many online coin and bullion dealers sell silver in various quantities. In the UK, the Royal Mint Bullion offers the opportunity to buy and sell the physical metal.
Alternatively, it is worth considering ETFs, such as the iShares Silver Trust (NYSE:SLV), which offer exposure to the day-to-day movement of the price of silver bullion. Its reference benchmark is the LBMA silver price as the world’s trade in bullion is mostly based in London. SLV's closing price as of July 24 was $21.21.
Finally, a rising tide usually lifts most stocks in an industry, so if you believe that the price of the metal may climb further in the coming months, you may consider buying into silver miners through an ETF. Here's one to consider.
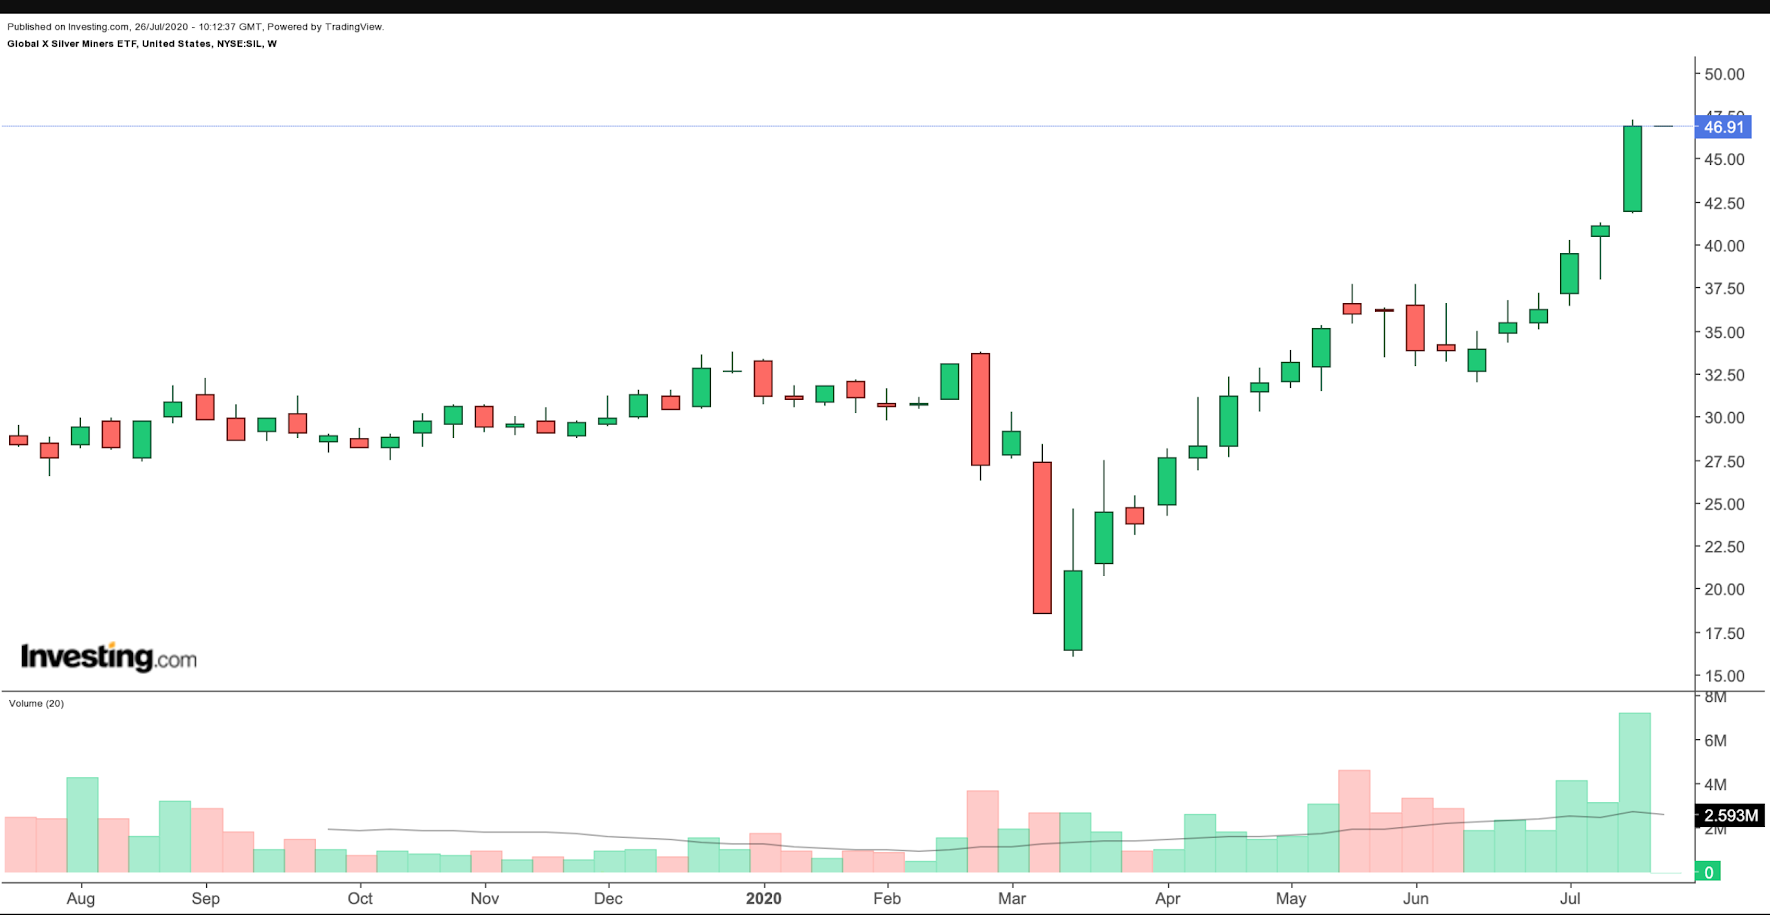
Global X Silver Miners ETF
- Current Price: $46.91
- 52-week range: $16-$47.22
- Dividend Yield: 1.17%
- Expense Ratio: 0.66% per year, or $66 on a $10,000 investment.
The Global X Silver Miners ETF (NYSE:SIL) offers access to a broad range of silver mining companies. It follows the Solactive Global Silver Miners Total Return index.

The top three companies in the ETF are Wheaton Precious Metals Corp (NYSE:WPM), Polymetal International (LON:POLYP), and Pan American Silver (NASDAQ:PAAS), accounting for about 45% of the fund.
SIL can be regarded as a leveraged play on the price of silver. As the price of the white metal rises, miners' margins generally improve, and profits increase.
Therefore, miners tend to overshoot price action in the metal, both to the upside and the downside. The same holds true for gold miners, too. Prices of mining stocks can turn around in a hurry.
Year-to-date, SIL is up around 41%. Some profit-taking and a potential decline toward the $40-level may be around the corner.
