Anyone who trades natural gas should know its production has been falling with the collapse in the number of rigs deployed in U.S. gas basins and the drop as well in associated gas produced from shale oil drilling. The trouble is figuring out how much it’s fallen because of the COVID-19 pandemic.
Lack of timely data on natural gas output, quantifying losses in associated gas production, has hampered longs in the market from getting out the good news that could make a difference to price stability. In their absence, the market is getting crushed on another piece of information that’s more easily accessible and digestible: falling LNG demand.
With another weekly update on U.S. natural gas storage due from the Energy Information Administration at 10:30 AM ET (14:30 GMT), analysts tracked by Investing.com have a consensus for a build of 107 billion cubic feet for the week ended May 8. If that’s accurate, it would be the second straight week of three-digit builds for gas and the continuation of the 100-bcf-plus series last seen in September.
Little Clue Of Gas Volumes Lost In Associated Output
But beyond storage, those in the market are questioning what the loss in associated gas production has been. The EIA doesn’t provide prompt updates on this, leaving analysts, traders and investors to second guess the agency during gaps in the production data it issues.
Market intelligence firm Genscape Inc., which has estimated a 107 bcf storage build for last week, estimates that there is around 2 bcf daily of associated gas for every million barrels per day of oil.
“While underlying gas demand has yet to stage a meaningful rebound from COVID-19 related demand destruction, the demand impact from COVID-19 may have at least reached a near-term peak,” Eric Fell, senior natural gas analyst at Genscape, told the naturalgasintel.com portal.
Since the U.S. coronavirus outbreak exploded in March, it has decimated the typical commercial gas-driven heating demand seen for spring, as the pandemic forced hundreds of millions of Americans to shelter at home instead of turning up at office buildings for work or frequenting other indoor places of public interest.
Gas Rallied First As Oil Prices Crumbled
But simultaneously, drilling for oil crumbled as well as demand for crude took a bigger whack.
U.S. oil rigs, as measured by energy services firm Baker Hughes, fell by 33 last week to reach 292. Since the Great Recession of 2008/09, the oil rig count had previously never fallen beneath 300.
A combined reading of U.S. oil and gas rigs by Baker Hughes, meanwhile, fell by 34 to 374, sitting at 614 fewer than this time last year.
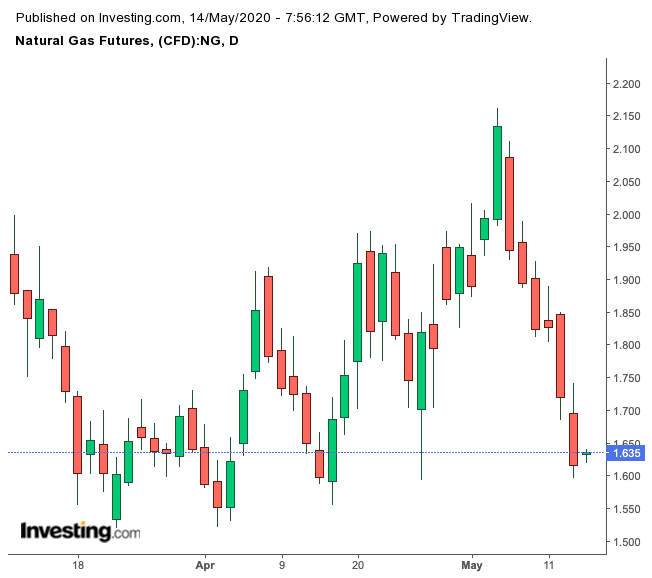
All that suggests a significant loss in associated gas production, which is basically a by-product that either gets flared or is transported to gas pipelines, adding to output. Front-month gas futures on the New York Mercantile Exchange’s Henry Hub actually hit an 11-week high of 2.162 per million metric British thermal units on May 5 on speculation over crumbling associated gas production.
Now Gas Is Down Again After Oil’s Rebound
But over the past week, Henry Hub’s fortunes have changed. By Wednesday’s settlement, the front-month June gas contract was down by just over 53 cents, or nearly 25%, from that May 5 peak to settle at $1.616 per mmBtu in the latest session.

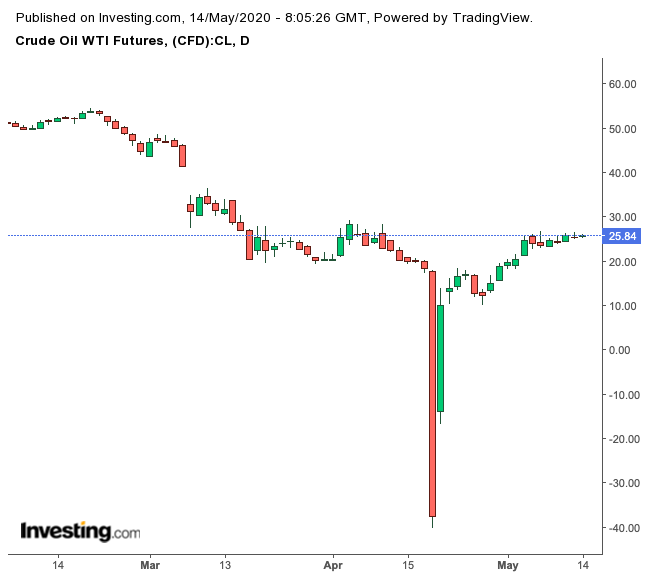
Gas prices tanked as oil prices surged instead over the past week as gasoline demand perked on optimism over the reopening of U.S. states from COVID-19 lockdowns. But WTI has also come under headwinds in the last 48 hours on fears that many U.S. states were ignoring safety measures in reopening and possibly courting a second wave of infections.
Nevertheless, the oil rally helped mitigate associated gas supply concerns and allowed near-term gas prices to crumble, EBW Analytics Group noted in a report.

While EBW remains bullish on the winter 2020-21 gas strip—which trades between $2.789 for December and $2.951 for February—it said near-term pricing “is likely to stay volatile as the market attempts to adjust to rapidly changing supply and demand expectations.”
Sinking LNG Demand Weighing Too On Gas
In the meantime, something else is weighing on gas prices, as we said earlier: crumbling demand for LNG, or liquefied natural gas.
As of last week, up to 25 LNG cargoes for June shipment were at risk, those in the know said.
“Reduced LNG demand and lost activity and power and industrial sectors have been the main market drivers in the sell-off over the past week, as a wave of gas threatens to flood into storage,” Dan Myers, analyst at Houston-based gas risk consultancy, said in a note to clients that was also shared with Investing.com.
A rapid plunge in LNG feed gas volumes in the past few days, and projections for even softer demand over the coming months, was accelerating the sell-off in gas, naturalgasintel.com added.
“The loss of LNG is a big deal given how loose we have been already,” Bespoke Weather Services said.
U.S. Gas Production As Whole Seen Peeling Back In 2020
In its latest Short-Term Energy Outlook, the EIA said that it expects LNG exports to average only 4.8 Bcf/d from July to September, roughly half of January peak levels.
For production, the EIA predicts a pull back as well. U.S. dry natural gas production set a record in 2019, averaging 92.2 Bcf/d. But the EIA forecasts dry natural gas production will average 89.8 bcf per day in 2020, with monthly production falling from an estimated 93.1 bcf in April to 85.4 bcf in December.
Natural gas production will decline the most in the Appalachian region and Permian region.
In the Appalachian region, low natural gas prices are discouraging producers from engaging in natural gas-directed drilling, and in the Permian region, low oil prices reduce associated gas output from oil-directed wells. In 2021, forecast dry natural gas production averages 84.9 bcf per day, rising in the second half of 2021 in response to higher prices.
Disclaimer: Barani Krishnan does not own or hold a position in the commodities or securities he writes about.
