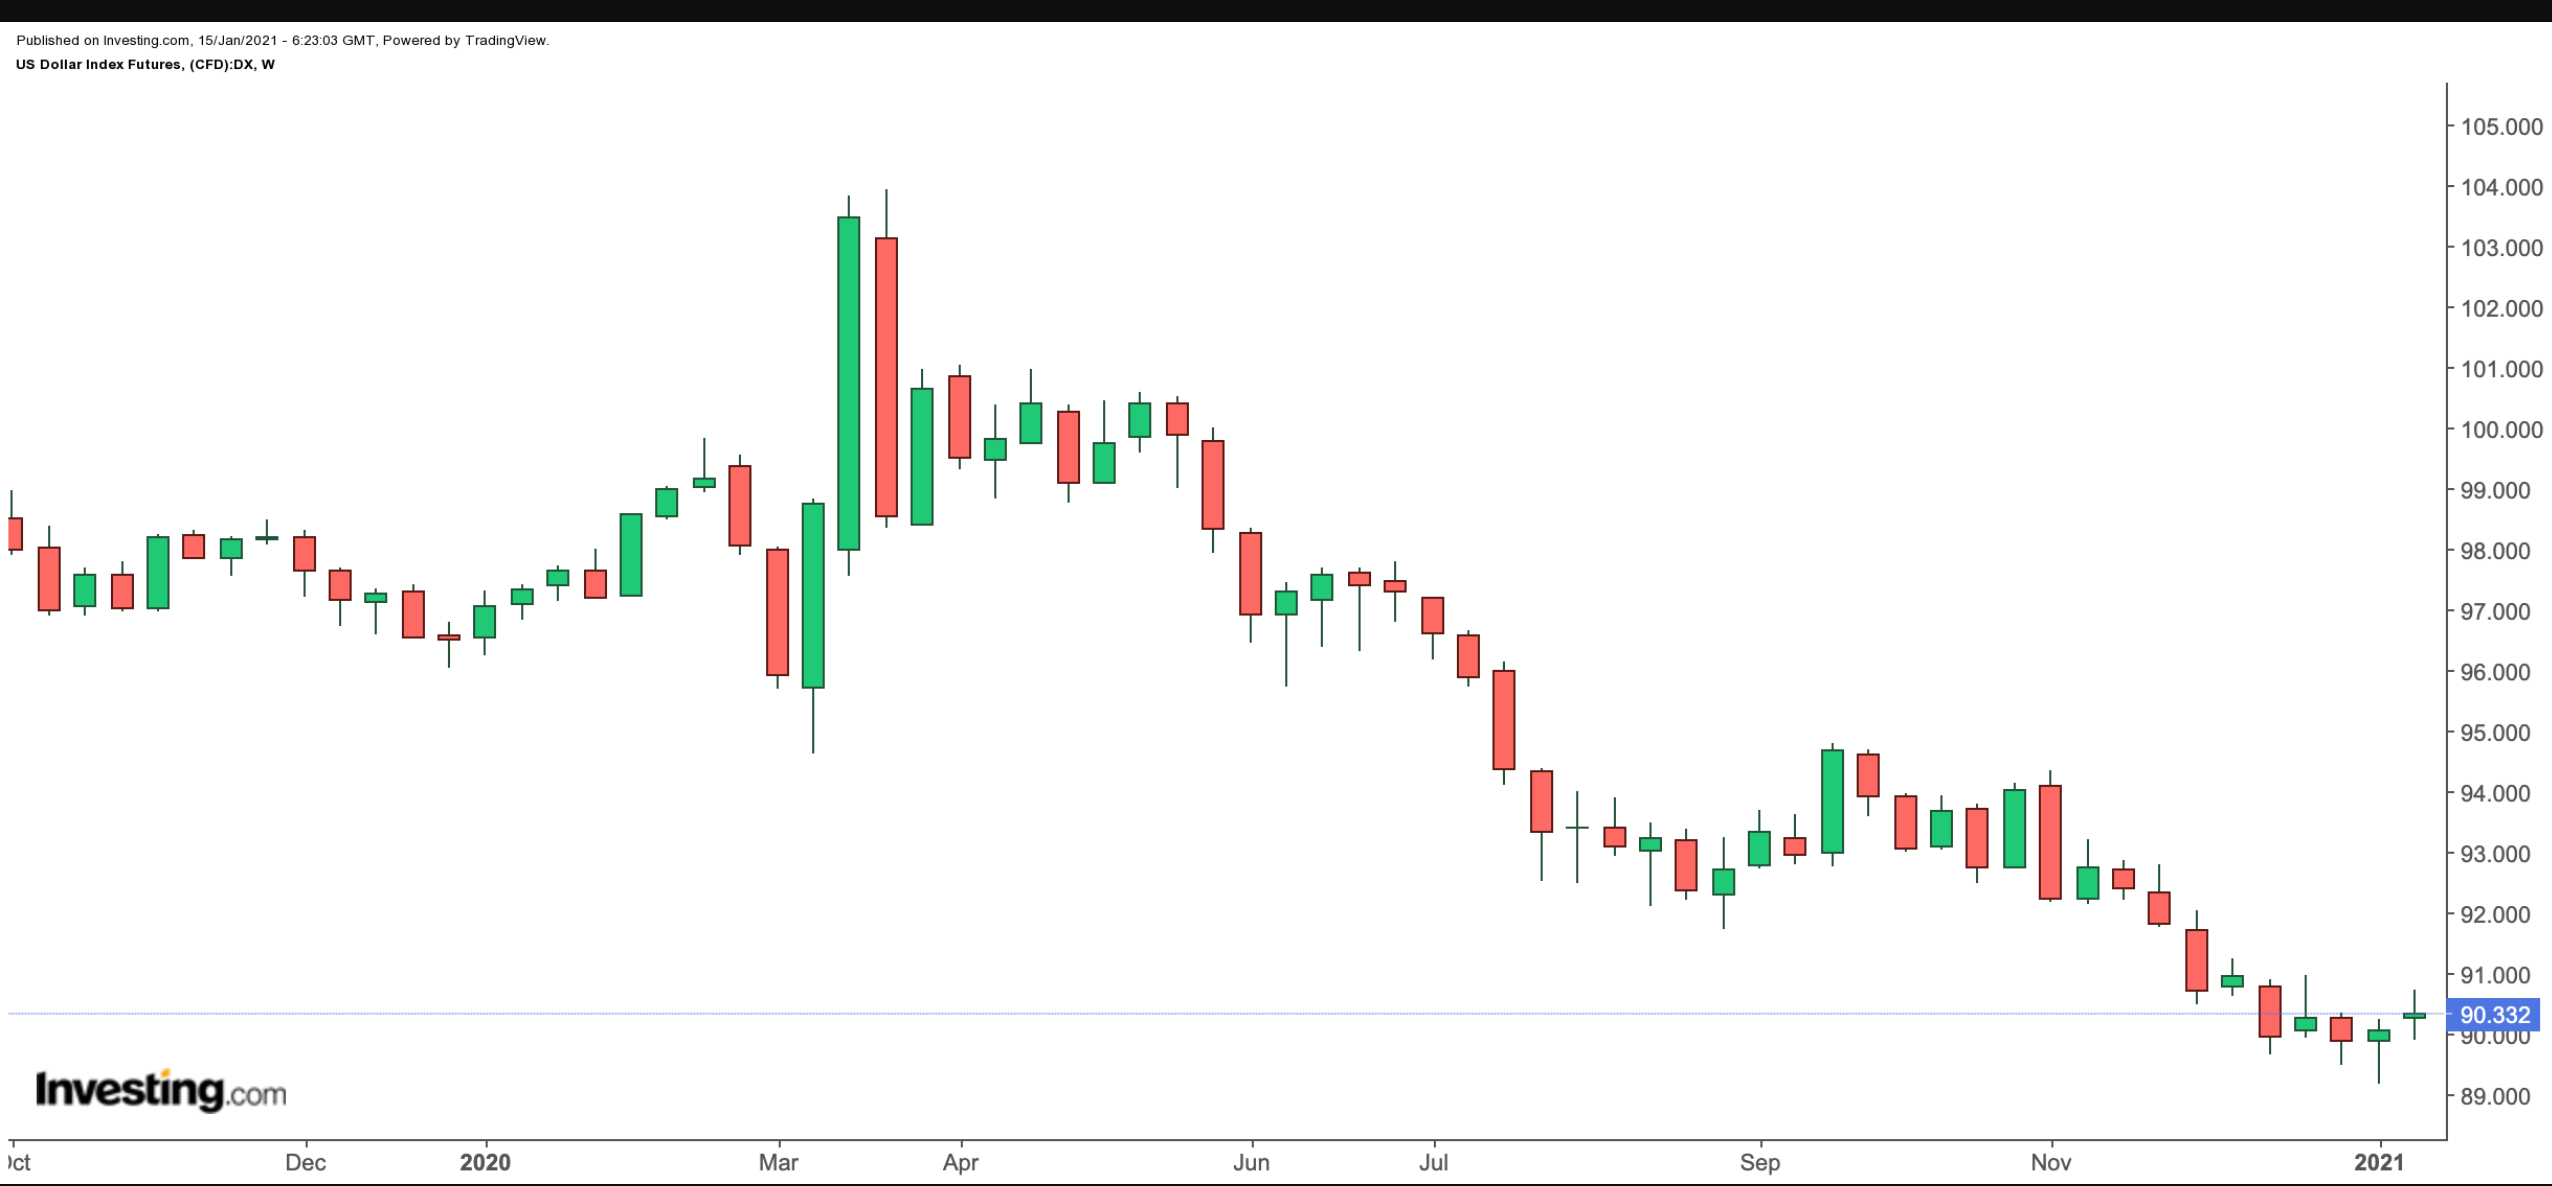
Since March 2020, the US Dollar Index, which measures the value of the greenback relative to a basket of six currencies from some of the most significant U.S. trading partners, has been steadily declining. It is currently flirting with 90.

The prospects of a third stimulus package and hopes for positive economic news thanks to the increased availability of the COVID-19 vaccine, however, are causing headwinds for the U.S. dollar.
For U.S.-based investors, moves in the greenback could potentially affect security returns overseas, while emerging-market (EM) bulls typically cheer a weak U.S. dollar. Many EM currencies took a beating in 2020. However, in November, the tide began to turn, favoring EM currencies vis à vis the U.S. dollar.
Over the past year, emerging market equities have seen robust returns. The iShares MSCI Emerging Markets ETF (NYSE:EEM), for instance, is up about 20%, after hitting a record $50.99 on Jan. 14. By comparison, the S&P 500 is up about 16.5% over the past 52 weeks.
For many retail investors, international exposure that includes EM stocks or exchange-traded funds (ETFs) could provide diversification, leading to higher absolute returns.
We recently covered}} the iShares Latin America 40 ETF (NYSE:ILF) that provides access to large businesses in the region. Today, we extend that discussion.
iShares MSCI Emerging Markets ex China ETF
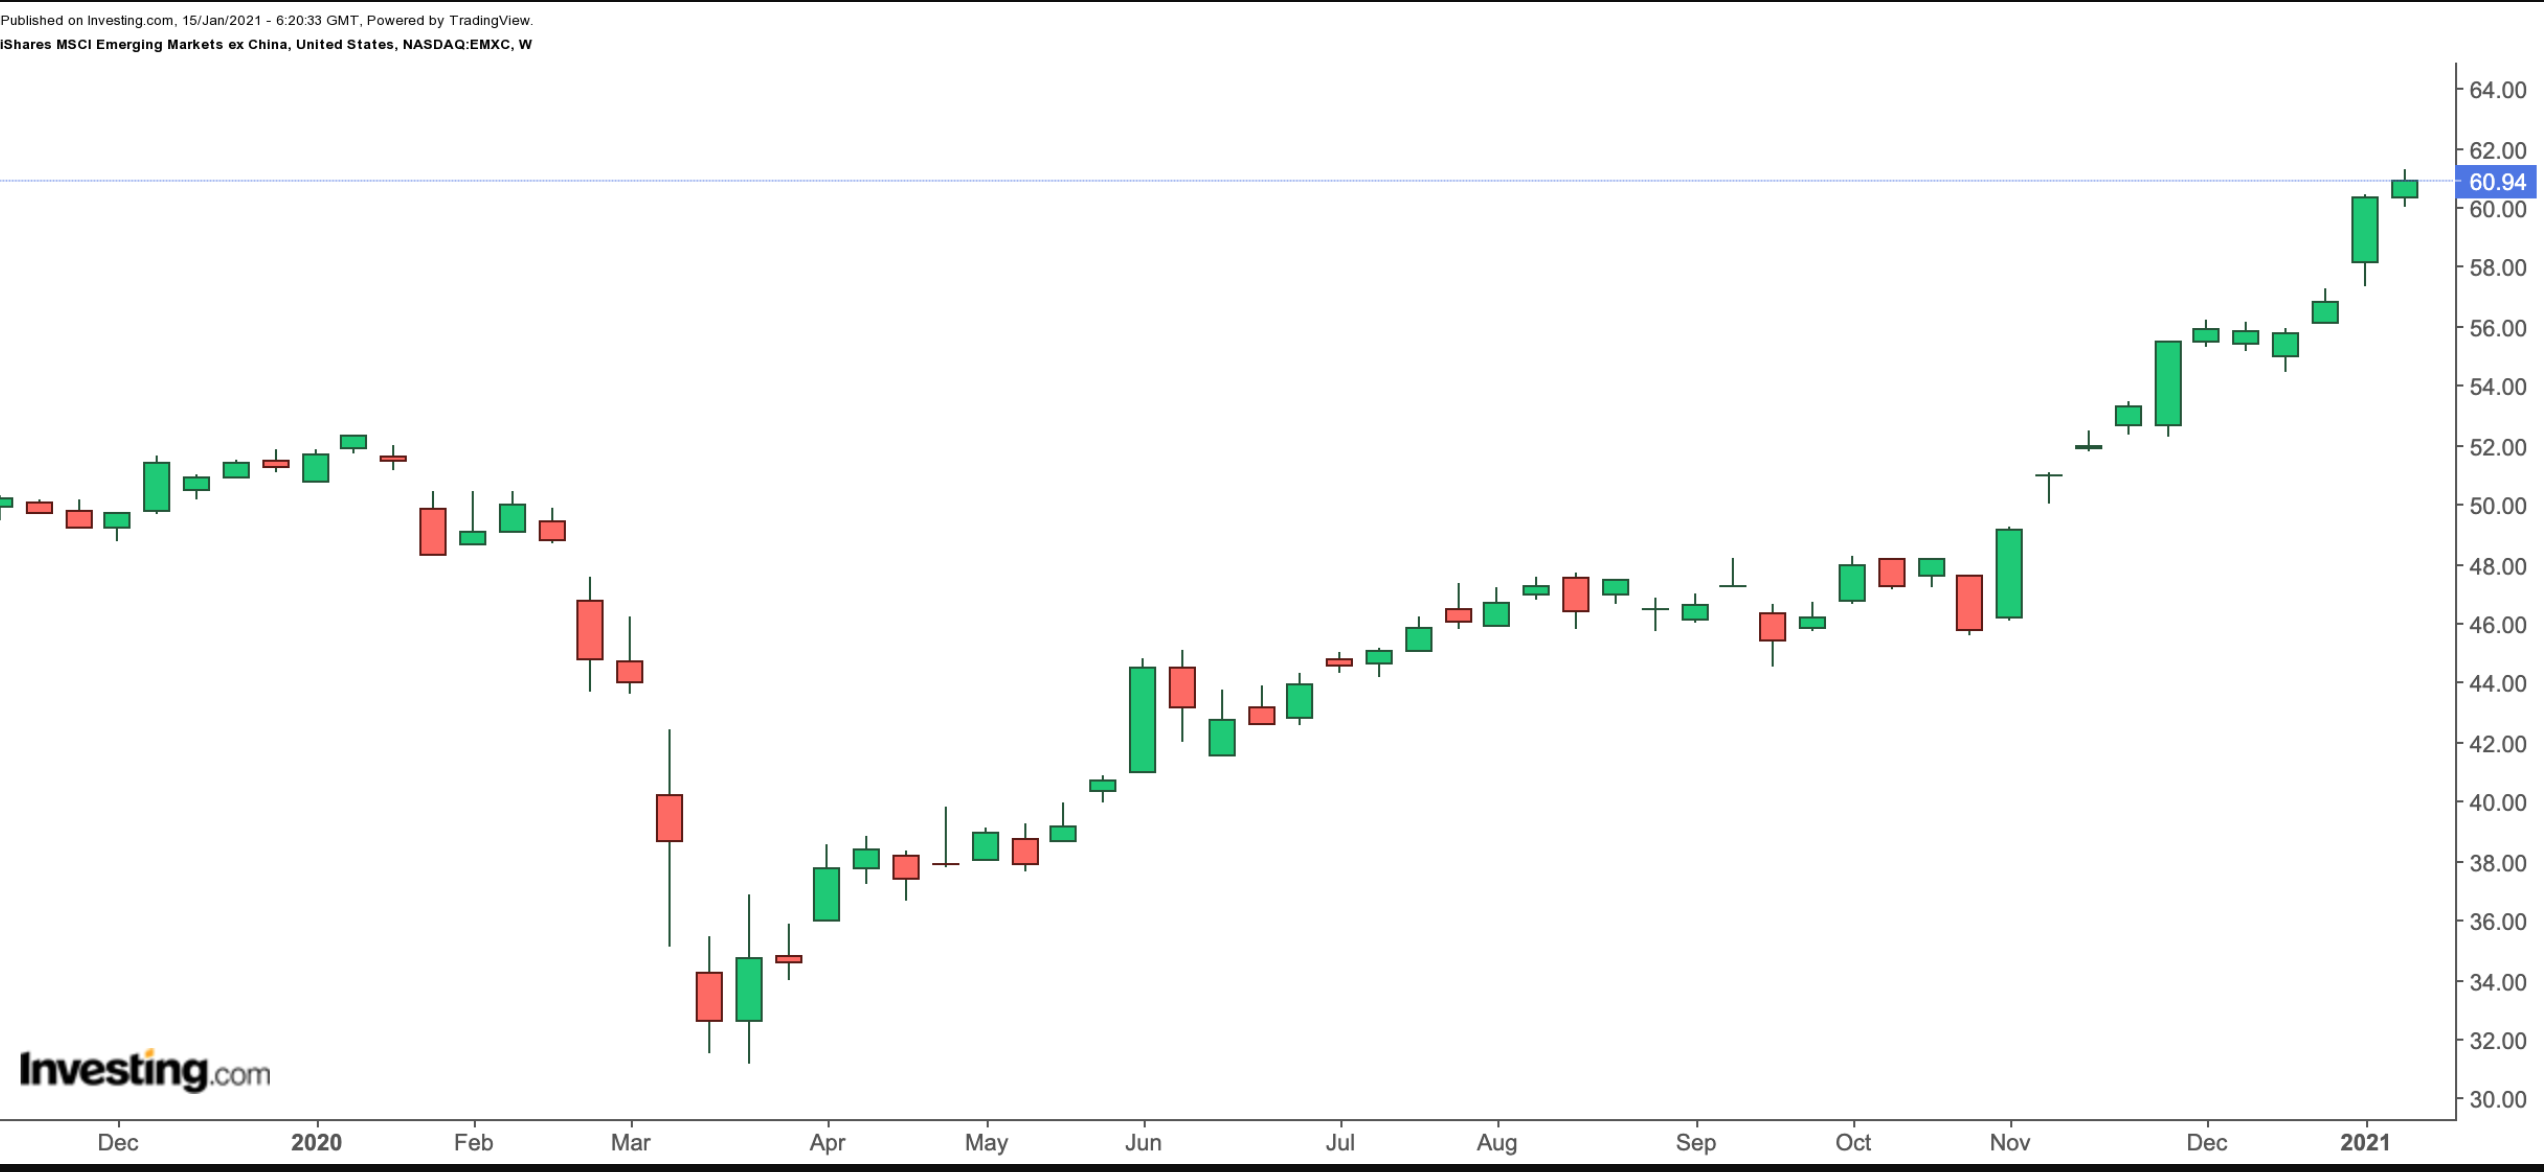
Current Price: $60.94
52-Week Range: $31.17 - $61.30
Dividend Yield: 1.33%
Expense Ratio: 0.25%
iShares MSCI Emerging Markets ex China (NASDAQ:EMXC) provides exposure to large- and mid-cap EM companies, excluding China-based businesses.

EMXC, which tracks the MSCI Emerging Markets ex China Index, has 529 holdings. The fund started trading in 2017, and net assets stand around $193 million.
In terms of countries represented, South Korea heads the roster with 22.83%. Next in line are Taiwan (21.61%), India (14.85%), Brazil (7.90%), South Africa (5.38%), the Russian Federation (4.78%), Saudi Arabia (3.92), Thailand (2.94%), Mexico (2.81%) and others.
iShares MSCI India ETF (NYSE:INDA), Taiwan Semiconductor Manufacturing (NYSE:TSM), South Korean chip groups Samsung Electronics (KS:005930) (OTC:SSNLF) and SK Hynix (KS:000660), South African internet and technology businesses Naspers (JO:NPNJn) and Brazilian miner Vale (NYSE:VALE) are the top names in the fund.
Over the past 52 weeks, EMXC has returned close to 17%. The fund has started 2021 well. It is up 7.2% year-to-date (YTD) hitting a record-high on Jan. 14.
Trailing P/E and P/B ratios are 19.27 and 2.06, respectively. In the case of potential short-term profit-taking, long-term investors could look to enter the fund between $57.5 and $60.
Bottom Line
In recent weeks, market participants have been looking at parts of emerging markets offering value. We believe the trend could stay intact, at least in the first half of 2021. However, as always, proper due diligence would be required. The risk/return profile of each emerging country or region is likely to be different.
There are several other EM funds that we believe could pique readers' interest. They include:
iShares MSCI India ETF (NYSE:INDA)—up 16.1% in a year and up 3.9% YTD. This fund could be of interest to investors who see a more significant role for India under the new Washington administration.
iShares MSCI Turkey ETF (NASDAQ:TUR)—down 2.92% in a year, but up 6.7% YTD. This fund could be of interest to investors who see more stability in the Turkish lira and that country’s economy, especially following the recent steps taken by its central bank.
ProShares MSCI Emerging Markets Dividend Growers ETF (NYSE:EMDV)—down 0.8% in a year, but up 4.6% YTD. This fund provides exposure to 58 EM businesses with consistent dividend growth.
SPDR® S&P Emerging Asia Pacific ETF (NYSE:{{38274|GMF)—up 27.9% in a year and up 6.8% YTD. This fund gives access to emerging market economies in the Asia Pacific region, with about half based in China.
