Pros and Cons
The recent rally in commodity prices has surprised many market participants and has greatly supported the stock market’s rebound. It has also made bulls out of a number of former stock market bears, as one of its side effects was to cause an improvement in market internals. But does the rally actually make sense?
As always, there are arguments both for and against the idea. We will take a look at several of them below.
The Secular Trend
First of all, it is widely held that the “commodity super-cycle” as it used to be called (i.e., the secular bull market that started in 1998) is definitely over. One could well say that there is a near 100% consensus on this question. After all, the CRB Index has declined to a 43 year low, i.e., to levels last seen in the 1970s.
Anyone who has watched commodities over recent years must surely wonder how this is even possible. For instance, crude oil recently bottomed at around $28, or 180% above its low of 1998. Gold bottomed at around $1,050 – more than 300% above its 1999 low. As far as we know, the only major commodity that has come anywhere near its lows of 18 years ago was natural gas.
We have discussed the reason for this on a previous occasion – the CRB Index reflects the futures roll effect. Once commodities are either in backwardation or in contango for an extended time period, the index will become ever more distorted relative to spot prices (for details see “How Big is the Bust in Commodities Really?”). So if one wants to know what the state of the secular trend in commodities prices is, one has to look at a spot price index:
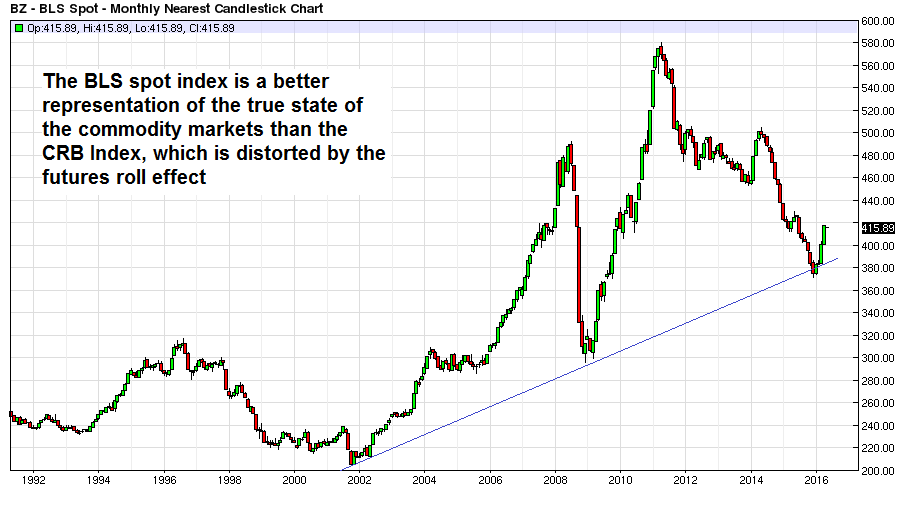
BLS Spot Commodities Index – arguably, the secular uptrend in nominal commodity prices actually remains intact.
Of course, it should be clear that in spite of the huge volatility of the index depicted above and the seemingly intact secular uptrend, commodity prices have been declining in real terms forever. As long as there is a market economy – even a hampered one like the one in place today in most of the world – the long term downtrend in real prices will continue.
The above chart already hints at another fact we have often mentioned in these pages: nominal commodity prices are not only a function of the supply-demand fundamentals of commodities themselves. They also reflect the supply-demand fundamentals of the medium of exchange they are priced in.
Given that the supply of dollars in the US economy (TMS-2) has increased by approximately 312% since the year 2000, we should expect that most nominal commodity prices will probably never again decline to their 1998 – 2002 lows (note: not all commodities bottomed at the same time). It is highly unlikely that copper will ever trade at 30 cents/lb. again, unless it becomes superfluous because a perfect and very cheap to produce substitute is discovered.
In terms of the secular trend in nominal prices, we would take the above chart of spot prices and the vast increase in the money supply since the lows were put in at the end of the 20th century as positives. The recent rally could well turn out to be the “real deal” – i.e., an advance that could potentially go a lot further.
A Major Driver of Prices
Speaking of the money supply, here is what we think is the main reason for the recent rally. It seems a decision was made in China at the beginning of Q4 2015 to at least temporarily throw the “transformation of China’s economy” overboard and return to the old model of egging on the real estate bubble and capital spending by means of a massive credit expansion.
To this we can only say: Mission accomplished!
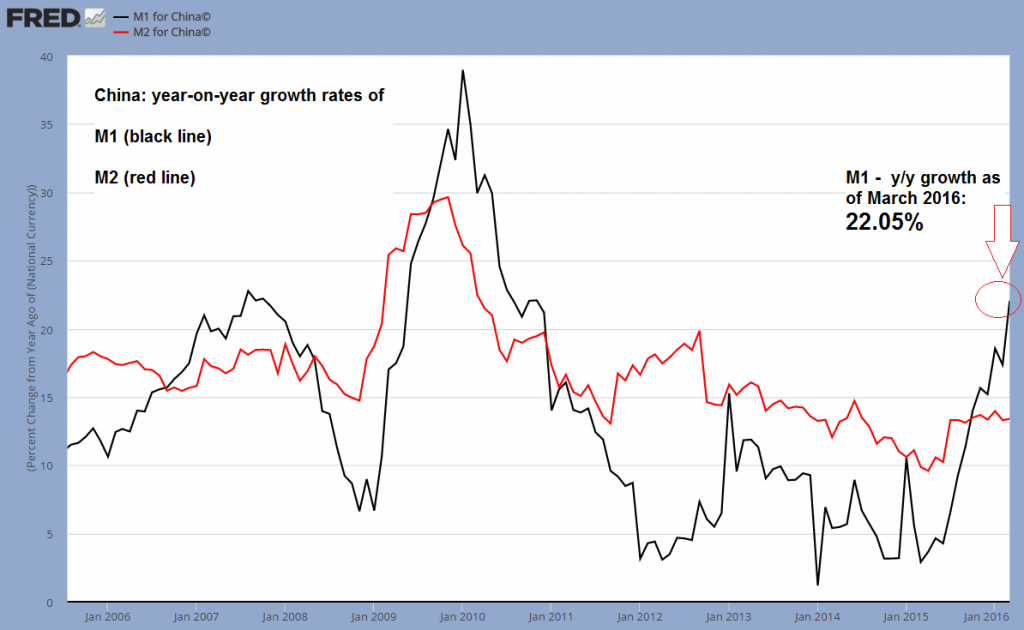
The y/y growth rate of China’s narrow money supply M1 has exploded from a low of 1.17% in January of 2014 to a recent 22.05%. Most of the growth spurt took place between September 2015 and March 2016, as bank lending in China suddenly went “off the charts”.
We don’t think this is in any way sustainable, but the lagged effects of this massive dose of monetary pumping could still be playing out for a while. As Ambrose Evans-Pritchard (AEP) informs us, a number of eye-popping signs of bubble excess have already become evident:
China’s reflation drive has been explosive. New home sales jumped 64pc in March from a year earlier. House prices have risen 28pc in Beijing, 30pc in Shanghai, and 63pc in the commercial hub of Shenzhen. The rush to buy has spread to the Tier 2 cities such as Hefei – up 9pc in a single month.
“The housing market is on fire,” said Wei Yao, from Societe Generale. “In the first quarter, increases in total credit exploded to 7.5 trilion yuan, up 58pc year-on-year. There is no bigger policy lever than this kind of credit injection.”
“This looks like an old-styled credit-backed investment-driven recovery, which bears an uncanny resemblance to the beginning of the“four trillion stimulus” package in 2009. The consequence of that stimulus was inflation, asset bubbles and excess capacity. We still think that this recovery will not last very long,” she said.
The signs of excess are visible everywhere as the Communist Party once again throws caution to the wind. Cement production jumped 24pc in March and infrastructure investment rose 19pc.
(emphasis added)
All the analysts quoted by AEP appear to be cautious and don’t believe the situation can last very long. One should be a bit wary of such a strong consensus. There is so far too little evidence that the money supply expansion is over, and even if it is, its effects are yet to fully percolate through the economy (we concede that commodity prices have eagerly discounted much of this recently – we just don’t know how much).
As Zerohedge has recently pointed out, there has been a huge inflow of “unsophisticated money” into China’s futures exchanges. We reproduce a quote from a Deutsche Bank) research report in this context:
The onshore China commodity markets this week traded (conservatively) $350bn notional, a 17x increase on the $20bn notional that traded on Feb 1st 2016 i.e. a month ago (is it coincidence that the notional is about the same as at the peak of the equity frenzy?).
My calculations are pretty basic; I’ve trawled the screens and chosen 32 commodities in agri, metals and coke/coal and done a quick (contracts x value)/CNY for a dollar amount. I have not used the largest day’s volume either (e.g. Deformed Bar, RBTA has traded close to $100bn, but I used closer to $60bn). Cotton (VVA Comdty) has been trading $15bn, up from $500mm in Feb. In the US, the long established cotton contract (CT1 Comdty) trades $600mm. China listed Sugar (CBA Comdty) has traded $14bn versus the US listed sugar beet at $850mm.
(emphasis added).
Yes, this is undoubtedly more than just a bit crazy. We have watched with amazement as the prices of Iron ore and steel rebar recently soared. And we agree of course that it is all a sign of “monetary disorder on steroids” as Doug Noland has put it. The question is though, whether the rally will still last for a while and how far it could potentially go.
With respect to that, there has been a bit of at least superficially negative news recently, as Reuters reports that China’s authorities are busy clamping down on the flood of retail money rushing into the futures markets (see “China securities regulator confirms order to curb futures speculation” for details).
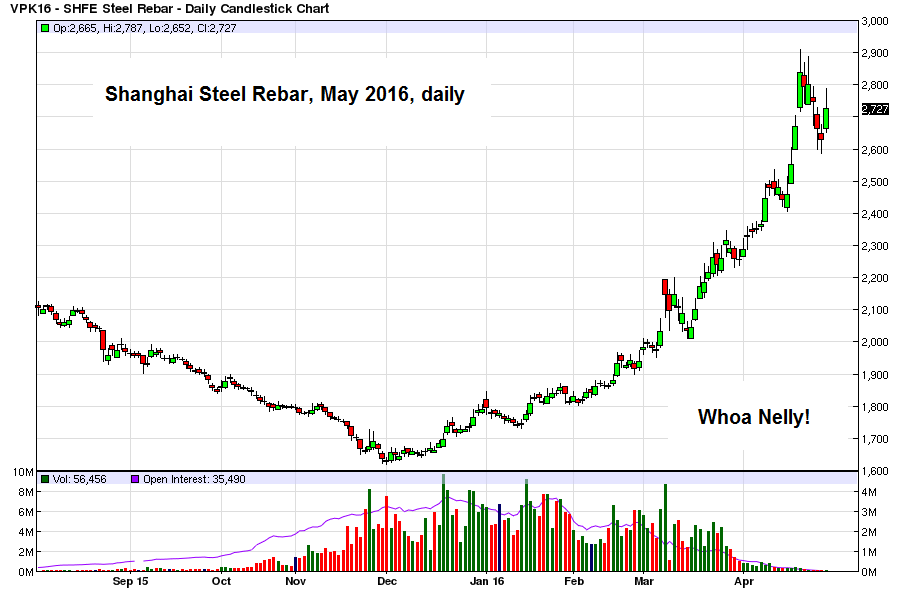
Steel suddenly gets a lot more expensive in Shanghai.
We would certainly also be inclined to consider such an outburst of unbridled speculation as a potential negative. There is only one problem with that at the moment. Below is a snapshot of the steel rebar futures curve as of April 29 – as you can see, there is now noticeable backwardation in evidence (and the same is the case in iron ore futures):
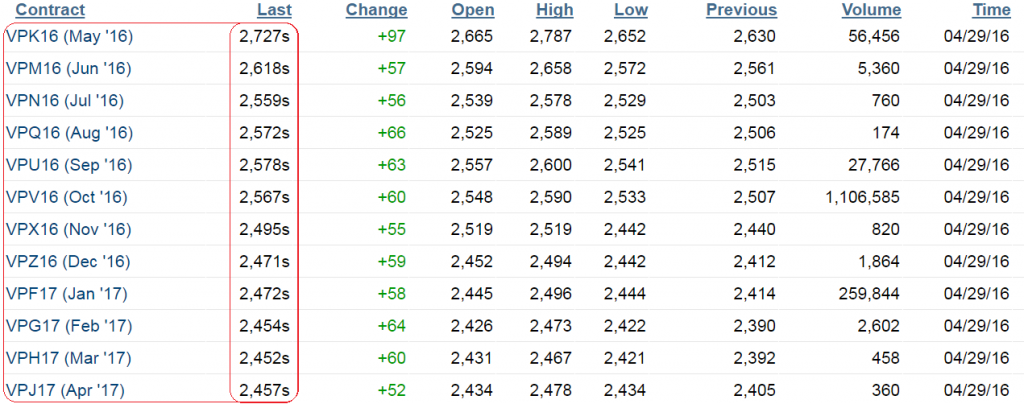
Shanghai steel rebar futures: backwardation for as far as the eye can see.
Backwardation in futures markets is generally a bullish sign. As incredible as this may sound, it is telling us that the market currently perceives a short term supply shortage in steel rebar and iron ore. As long as this is the case, we would certainly be careful about shorting these markets – although we do believe a correction may be imminent.
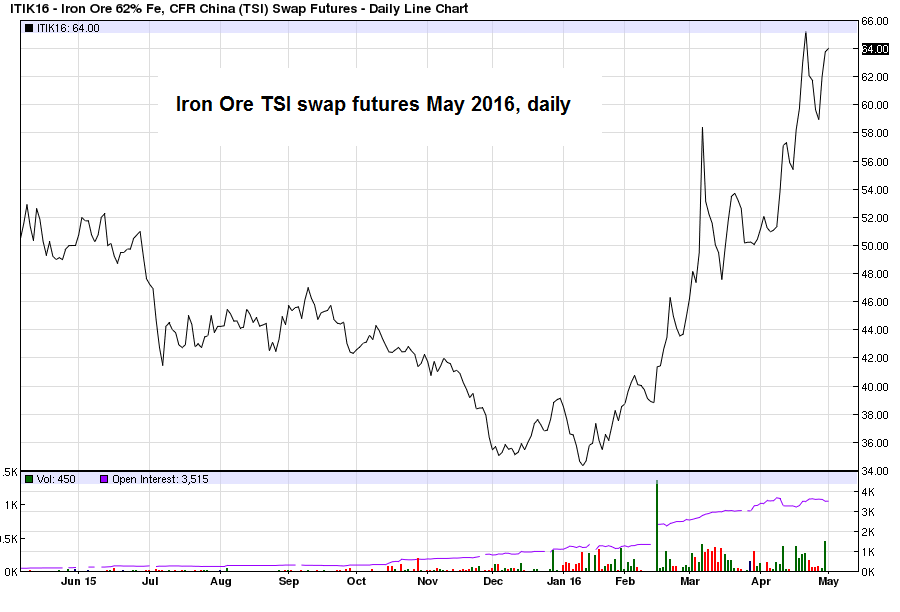
Iron ore has gone berserk as well
Commodity Stocks, Sentiment and Positioning
Here is how we would summarize the message from the price trend in the stocks of commodity producers, the sentiment picture and futures positioning as they look at the moment: likely prone to a correction in the short to medium term, but surprisingly bullish in the long term.
Just to clear this up: by short term we mean “days and weeks”, the medium term comprises “months” and the long term “years”. Again, we must stress that this is how we see things right now, based on the data as they currently are. There may well be reason to alter this assessment at a later stage, depending on how the data backdrop develops from here on out.
One instrument we are watching in this context is the SPDR S&P Metals & Mining Fund (NYSE:XME), an ETF. (A list of its holdings can be found here by clicking on the “holdings” tab on the page the link leads to – it is quite a hodge-podge, but more than 50% of the fund is invested in the steel industry. It also holds a few precious metals companies, but mainly it contains stocks of base metal producers). To say that this ETF has had an outstanding performance so far this year would actually be a bit of an understatement:
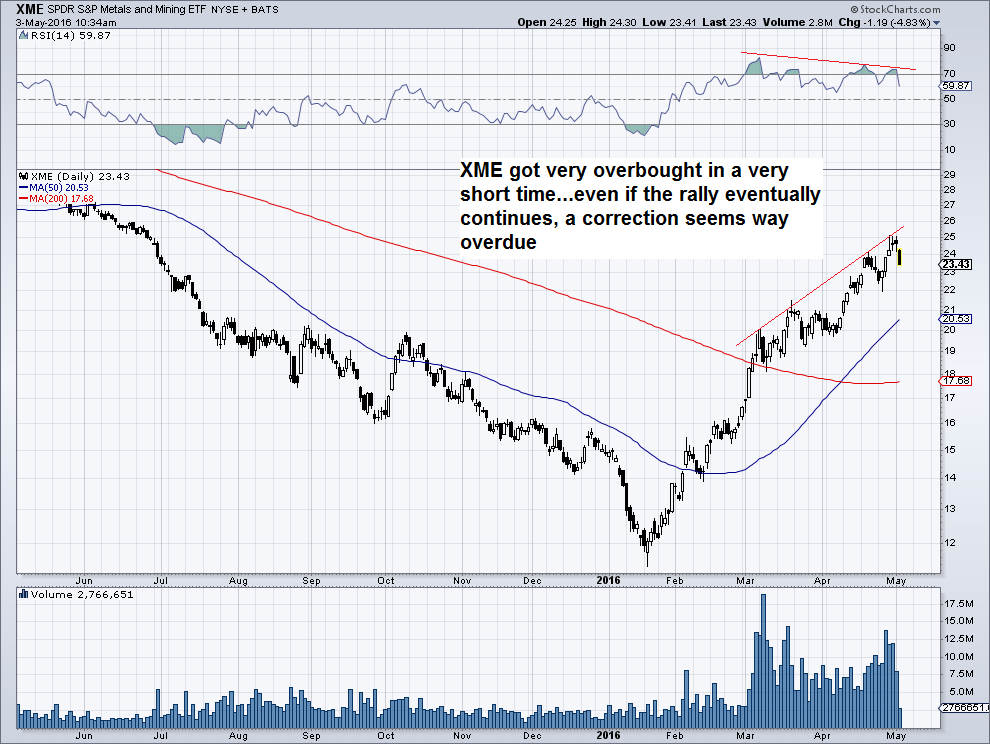
XME has delivered quite a strong return this year, rallying from just above $11 at the mid January low to a recent intraday high of $25. Note however the ongoing price/ RSI divergence – often a warning sign that a correction is not too far away.
Note though that while XME is quite overbought and a price/ RSI divergence warning continues to be in evidence, prices as such have not yet confirmed that a reversal is at hand (even though the ETF is down quite a bit as we are writing this). Also, we first became skeptical about XME’s short term prospects at $20, so one shouldn’t put too much stock in our short term opinion.
Trees don’t grow to the sky as the saying goes, however, the preceding bear market was quite relentless as well, so one cannot rule anything out. The main point we want to make though is this: by becoming this extremely overbought, the sector has certainly become risky in the short to medium term. However, it is more often than not also a long term bullish signal when this happens shortly after a sector has turned up from a bear market low.
On the sentiment and positioning front we have a very similar combination of signals. A long term positive is the fact that in early 2016, bullish sentiment on the commodities complex as a whole was at its lowest level since the 1998 low:
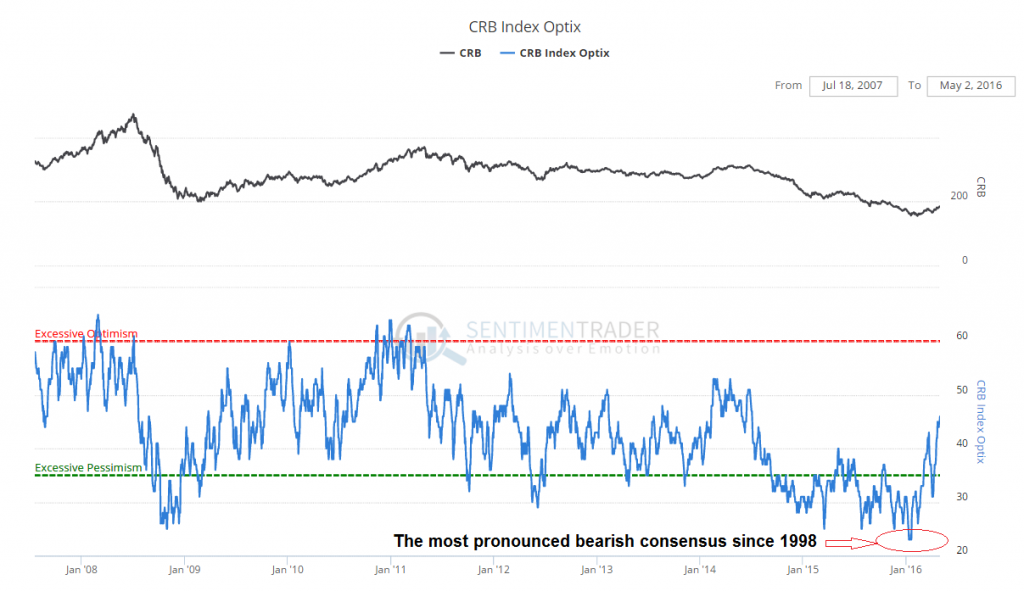
The CRB optimism index: the bearish consensus in early 2016 missed the one recorded at the 1998 secular low by a mere 2 points. It definitely did undercut the reading recorded at the 2008 crash low.
Similar records in the bearish consensus could be observed in nearly all individual commodities between late 2015 – early 2016 as well. As we have pointed out before: commodities tend to make medium to long term lows when both trader sentiment and their supply-demand fundamentals are in an absolutely atrocious state.
If one feels almost like a traitor by uttering a bullish opinion, secretly fears to be ostracized by one’s peers, and is beginning to wonder if one has maybe lost one’s mind after all, it is highly likely that a secular low in prices has been put in, or is about to be put in. Based on that, a long term low has probably been seen.
In the near term, there is a notable fly in the ointment though, in the form of extremely lop-sided speculator net long positions in commodity futures. It seems ever more likely that there will soon be some sort of shake-out. The chart below depicts the net hedger position (i.e., the inverse of the net speculative position) in all commodity futures combined – as can be seen, it has recently become quite stretched:
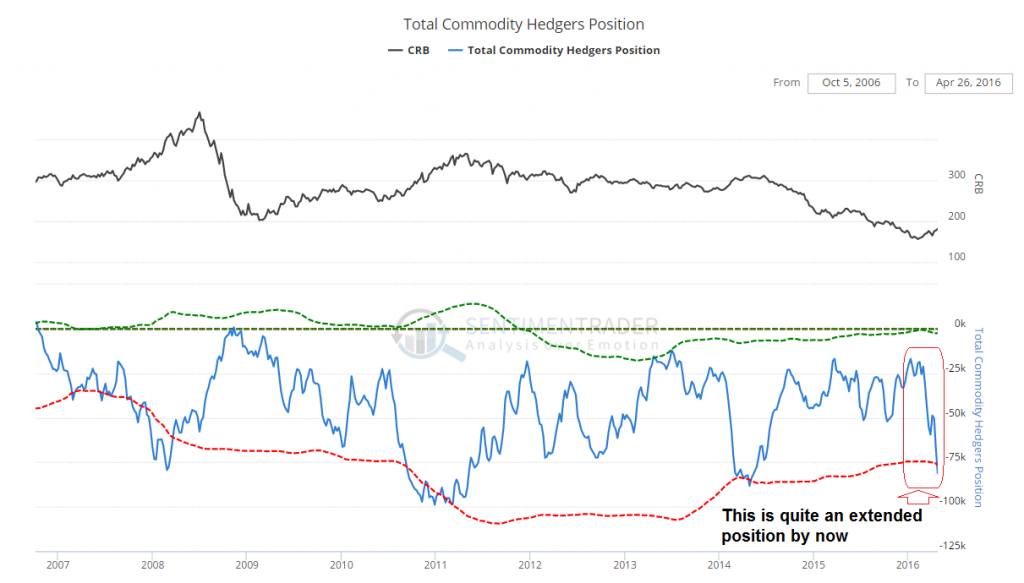
The total net hedger position in all commodity futures combined. The current reading is historically quite extended (speculators are holding the offsetting net long position). Per se this is not a bearish sign at all – but the more stretched the position becomes, the more vulnerable these markets will be to a shake-out/ correction.
The same that applies to the big rally in commodity stocks applies to such positioning readings as well: in the short term, they make the market vulnerable, but they are often (though not always) a positive long term signal. This is especially so when “overbought” readings occur in a scorching rally right on the heels of a severe bear market.
Conclusion
At the moment we would be inclined to exercise caution. We think it would be very risky to chase the advance in commodity prices it at this juncture. Given the overall backdrop, we wouldn’t be surprised though if it were to continue after a (possibly scary) correction.
China’s most recent bout of credit and money supply expansion has very likely triggered the rally, as it has altered market perceptions about commodities. Moreover, commodities have become very cheap relative to assets such as stocks and bonds, so there was an incentive for rotation as well.
The question is when these perceptions will reverse again, or whether they will perhaps be replaced with other reasons that can be used to rationalize a renewed rally phase. This is of course unknowable at the moment, but experience tells us that something usually turns up.
We were quite surprised to find iron ore and steel rebar futures in backwardation, but this is by itself a strong indication that the widely accepted fundamental story may actually be a bit flawed. Lastly, whatever you do, don’t ask Goldman Sachs about it. You really shouldn’t.
