When stock markets rise, the bullish narrative tends to dominate, overlooking the potential impact of market declines. This oversight stems from two main problems: a basic misunderstanding of math and time’s critical role in investing.
Every year, I receive the following chart as a counterargument when discussing the importance of managing risk during a portfolio’s life cycle. The chart shows that while the average bull market advance is 149%, the average bear market decline is just -32%.
So, why bother managing risk when markets rise 4.7x more over the long term than they fall?
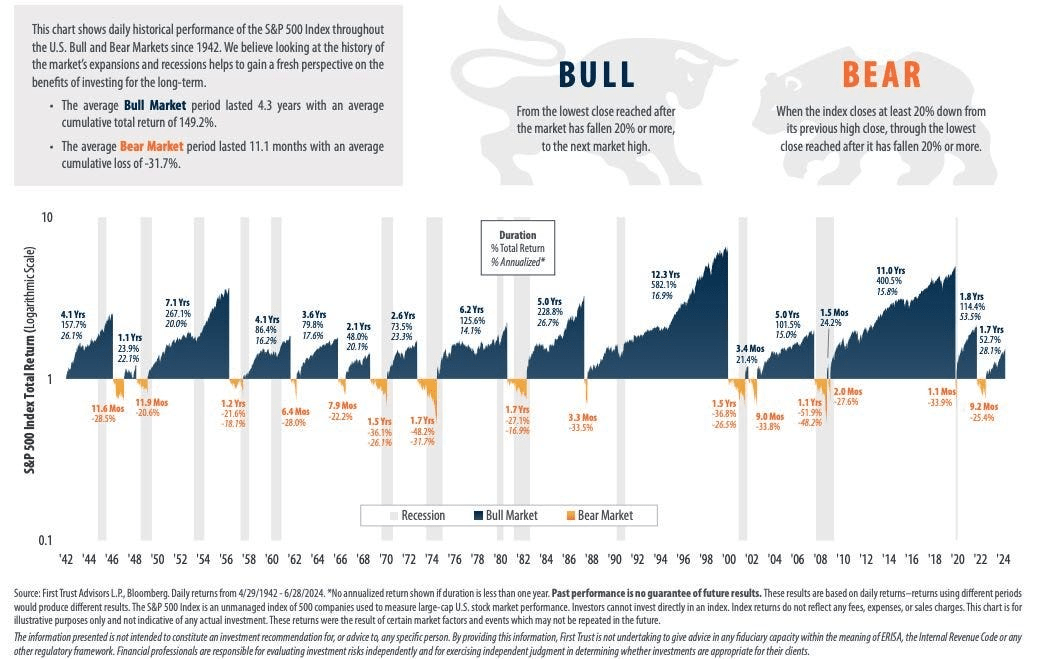
As with any long-term analysis, one should quickly realize the most critical issue for every investor—time.
The Reality of Long-Term Stock Market Returns
Yes, since 1900, the stock market has “averaged” an 8% annualized rate of return. However, this does NOT mean the market returns 8% every year. As we discussed recently, several key facts about markets should be understood.
- Stocks rise more often than they fall: Historically, the stock market increases about 73% of the time. The other 27% of the time, market corrections reverse the excesses of previous advances. The table below shows the dispersion of returns over time.
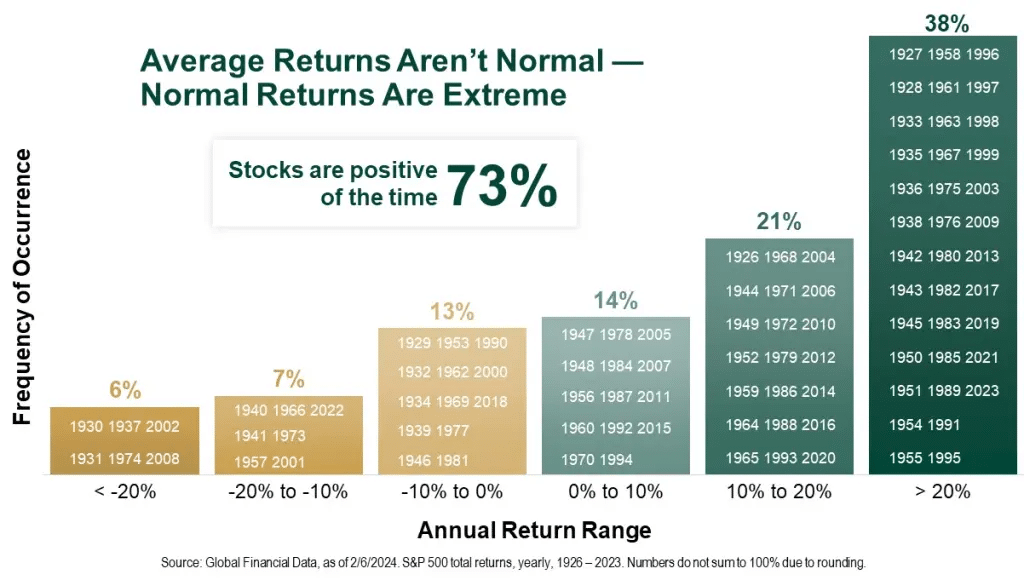
However, to achieve that 8% annualized “average” rate of return, you would need to live for 124 years.
Time is the Investor’s Biggest Challenge
The average American faces a sobering reality: human mortality. Most investors don’t begin seriously saving for retirement until their mid-40s, as the cost of living during earlier years—college, getting married, having kids—consumes much of their income. Generally, incomes don’t exceed the cost of living until the mid-to late-40s, allowing for a serious push toward retirement savings. Most individuals have just 20 to 25 productive working years to achieve their investment goals.
Investment studies should align time frames with human mortality rather than focusing on “long-term” average returns. There are periods in history where real, inflation-adjusted total returns over 20 years have been close to zero or negative. Interestingly, these periods of near-zero to negative returns were typically preceded by high market valuations—as we see today.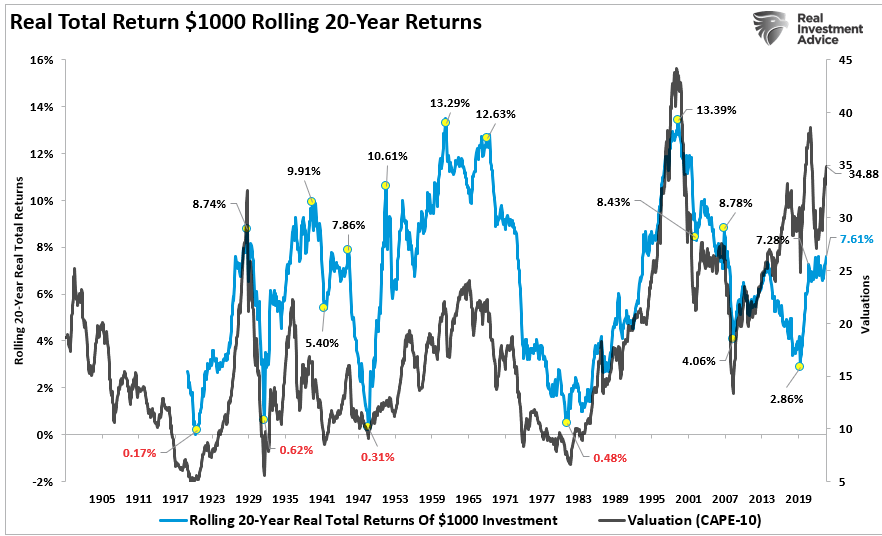
Time and valuations are the most important factors for those just beginning their investment journey.
The Problem with Percentage-Based Returns
Another issue with long-term analysis is the misunderstanding of basic math, as we discussed in “Market Corrections.”
Charts often show percentage returns, which can be deceptive without deeper analysis. Let’s take an example:
If an index grows from 1000 to 8000:
- 1000 to 2000 = 100% return
- 1000 to 3000 = 200% return
- 1000 to 8000 = 700% return
An investor who bought into the index generated a 700% return. According to First Trust, why worry about a 50% correction when you’ve just gained 700%?
However, the problem lies in the percentages. A 50% correction does NOT leave you with a 650% gain. It subtracts 4000 points from the index, reducing your 700% gain to just 300%.
Recovering those lost 4000 points to break even after a market decline is a much harder task. The real damage of a market decline becomes clear when we reconstruct the chart to display point gain/loss versus percentages. In many cases, a significant portion of a bull market’s gains are reversed by the subsequent bear market decline.
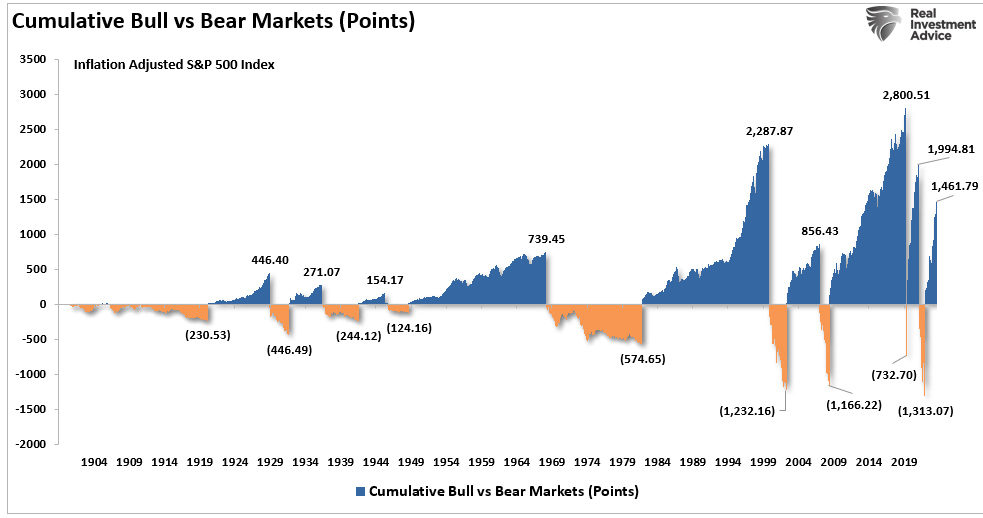
While markets do recover, mainstream analysis often overlooks one key factor: time.
Market Declines Are A “Time” Problem.
For most of us mere mortals, time plays a crucial role in our investing strategy. As shown in previous analyses, investors typically fall short of their expected outcomes when factoring in life expectancy and the time required for recovery from market downturns.
Below is a chart assuming a $1000 investment over each period and holding the total return until death. No withdrawals are made. The orange sloping line represents the “promise” of a 6% annualized compound return. The black line represents the actual outcome. In all cases except the most recent cycle starting in 2009, the invested capital fell short of the promised return goal.
The next significant downturn will likely reverse many of the gains from the current cycle, highlighting why using compounded or average rates of return in financial planning often leads to disappointment.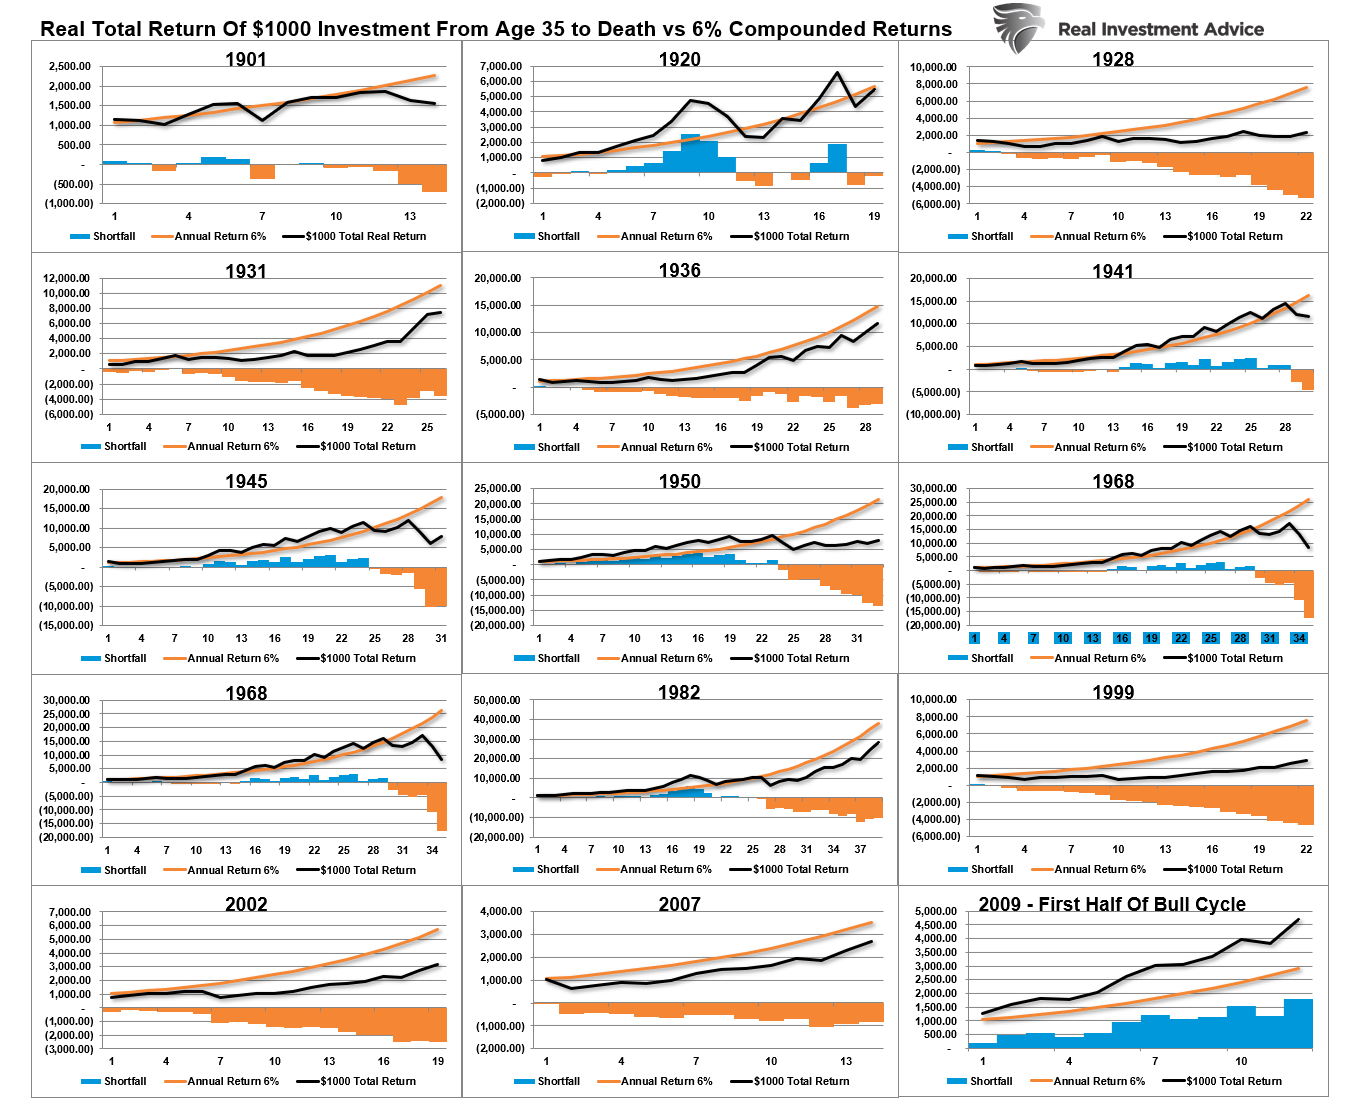
At the point of death, the invested capital is short of the promised goal in every case except the current cycle starting in 2009. However, that cycle is yet to be complete, and the next significant downturn will likely reverse most, if not all, of those gains. Such is why using “compounded” or “average” rates of return in financial planning often leads to disappointment.
The reason is that market declines matter, and getting “back to even” is not the same as accumulating capital. The chart visualizes the importance of market declines by showing the difference between “actual” investment returns and “average” returns over time.
The purple-shaded area and the market price graph show “average” returns of 7% annually. However, the return gap in “actual returns” due to market declines is quite significant.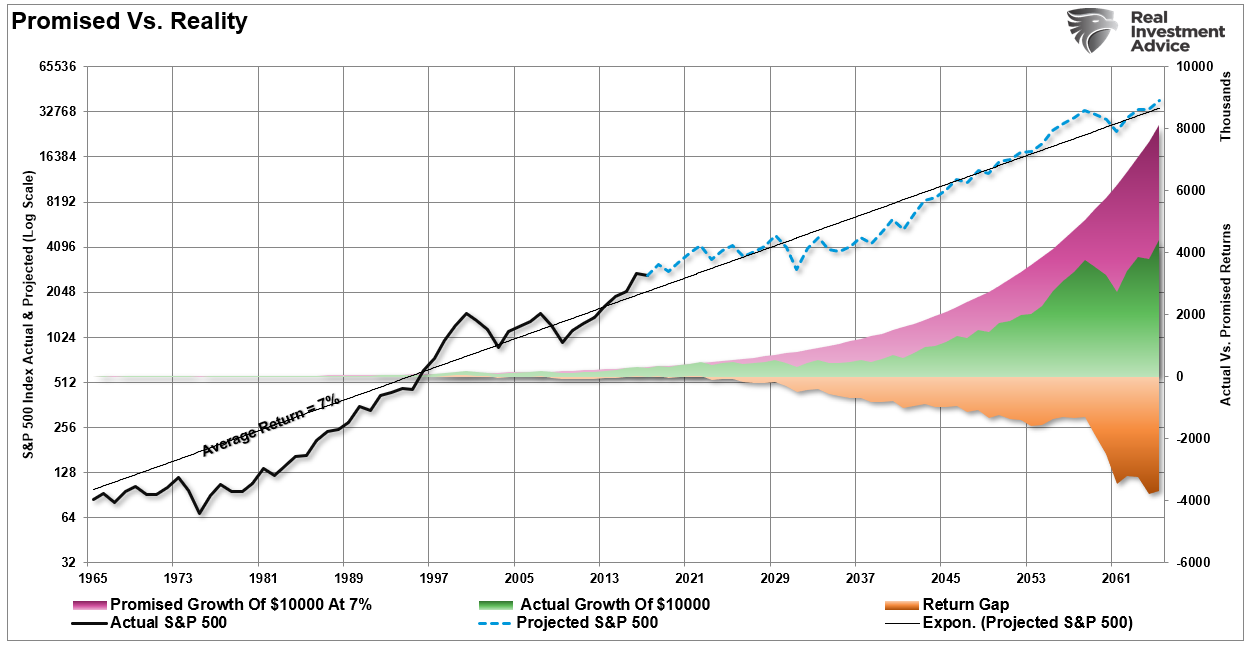
Why Time and Valuations Matter for Investors
Whether you’re five years from retirement or just starting your career, there are three key factors to consider in today’s market environment:
- Time horizon (retirement age minus starting age)
- Valuations at the beginning of your investment period
- Rate of return required to meet your investment goals
A buy-and-hold strategy may disappoint if valuations are high when you start investing, and your time horizon is too short or the required return rate is too high.
Mean reversion events often reveal the flaws of buy-and-hold investment strategies. Unlike a high-yield savings account, stock markets experience losses that can devastate retirement plans. (Ask any “boomer” who lived through the dot-com crash or the financial crisis.)
Investors should consider more active strategies to preserve capital during excessively high valuations.
Adjusting Expectations for Future Returns
Investors should consider the following:
- Adjust expectations for future returns and withdrawal rates due to current valuation levels.
- Understand that front-loaded returns in the future are unlikely.
- Consider life expectancy when planning your investment strategy.
- Plan for the impact of taxes on returns.
- Carefully assess inflation expectations when allocating investments.
- During declining market environments, reduce portfolio withdrawals to avoid depleting principal faster.
The last 13 years of chasing yields in a low-rate environment have created a hazardous situation for investors. It’s crucial to abandon expectations of compounded annual returns and instead focus on variable return rates based on current market conditions.
Conclusion: Don’t Chase the Market
Chasing an arbitrary index and staying 100% invested in the equity market forces you to take on more risk than you may realize. Two major bear markets in the last decade have left many individuals further from retirement than planned.
Retirement investing should focus on conservative, cautious growth to outpace inflation. Attempting to beat a random, arbitrary index with no connection to your personal financial goals is a risky game. Remember, in the market, there are no bulls or bears. There are only those who succeed in reaching their investment goals—and those who fail.
