Facebook (NASDAQ:FB) shares have been slipping since the end of January, after the social media giant's Q4 2019 earnings report indicated the company beat expectations on revenue but, during the quarter, experienced the slowest annual rate of revenue growth in its history amid increasing regulatory scrutiny. As well, traffic in 2019 dropped 8.6% according to web analytics service SimilarWeb, while other social media networks grew.
That's bad enough, of course, but what might really be the final thing to accelerate the stock's slide is a tweet sent out this past Saturday by Tesla's CEO Elon Musk declaring, "#DeleteFacebook It’s lame."
Indeed, charts are now hinting at a possible more serious drop in the coming months.

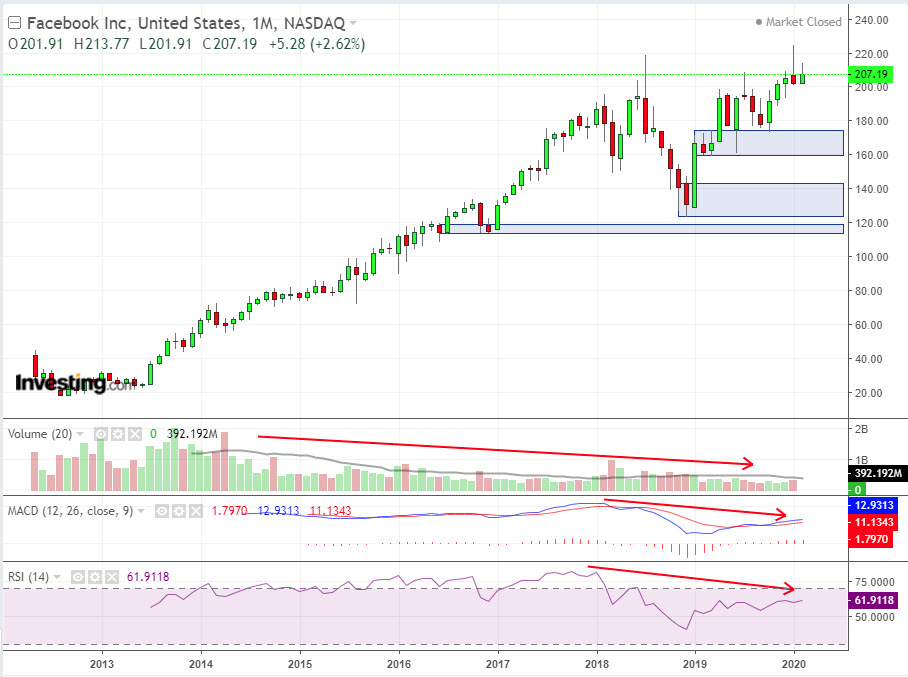
The monthly candle for January 2020 is a shooting star, which formed around the previous 43% drop between July and December 2018. In addition, the recent highs in the price are accompanied by bearish divergences in various indicators such as volume, MACD and RSI.
These divergences indicate weakness in the uptrend although it remains valid. As for the monthly demand levels, marked by blue rectangles on the above chart, the strongest demand sits between 120-130.

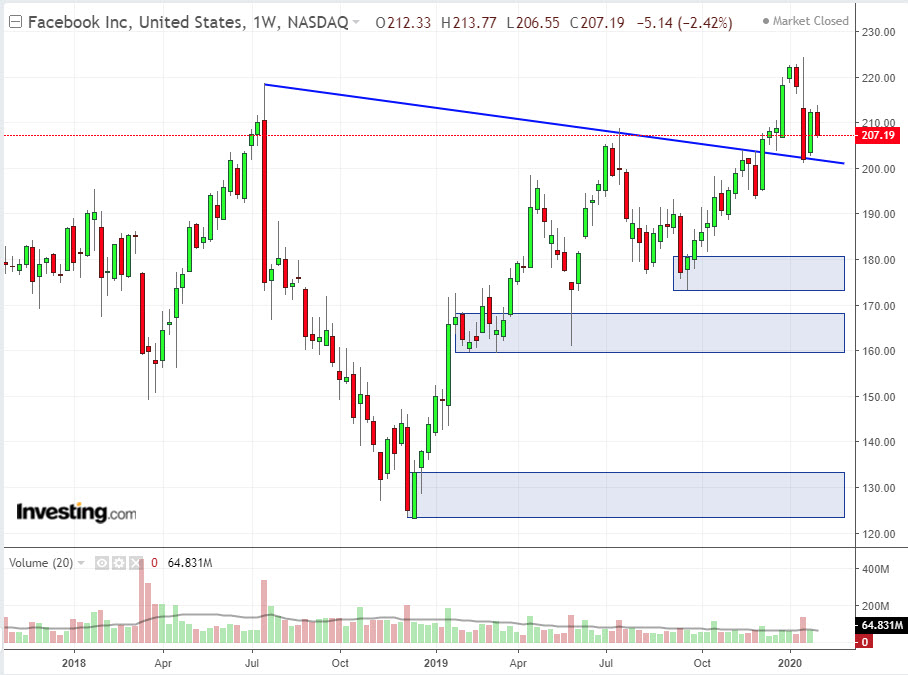
On the weekly chart, it's easier to see the strong selling pressure that began two weeks ago, after the earnings release. The closest support by the downtrend line (in blue) is around 200, where buyers might be waiting to buy the dip.

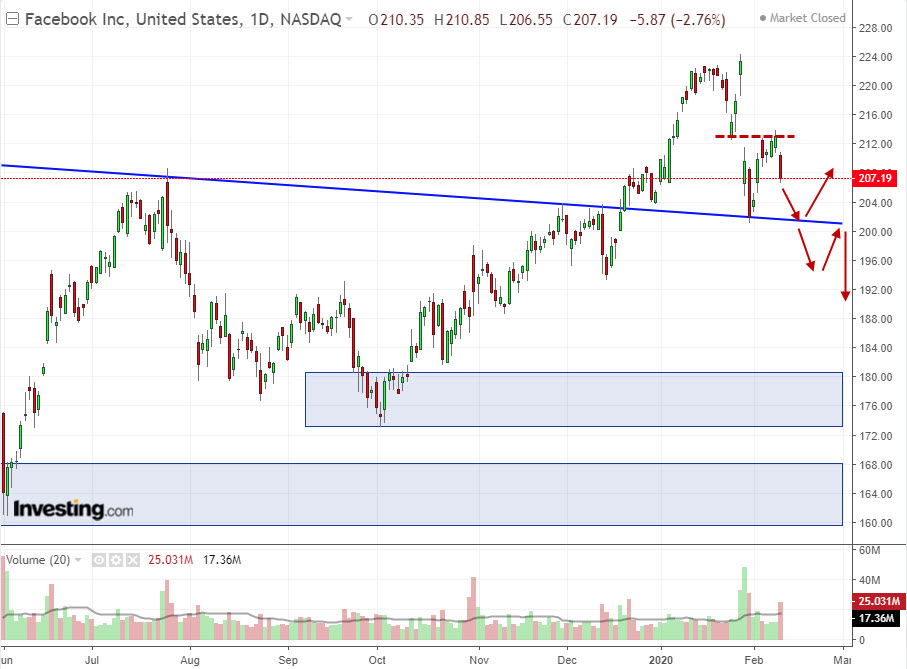
Yesterday, the price dropped sharply after having filled in the in the gap at 213 on Monday. We can also see, on the daily chart, that there are some potential moves around the trendline. Should the price break below the trendline, it could head down to the 194-196 area and retest the trendline from underneath, then continue going lower to 175-180.
